
ZECUSD Medium-term Trend: Sideways
Supply levels: $495, $490, $485
Demand levels: $465, $470, $475
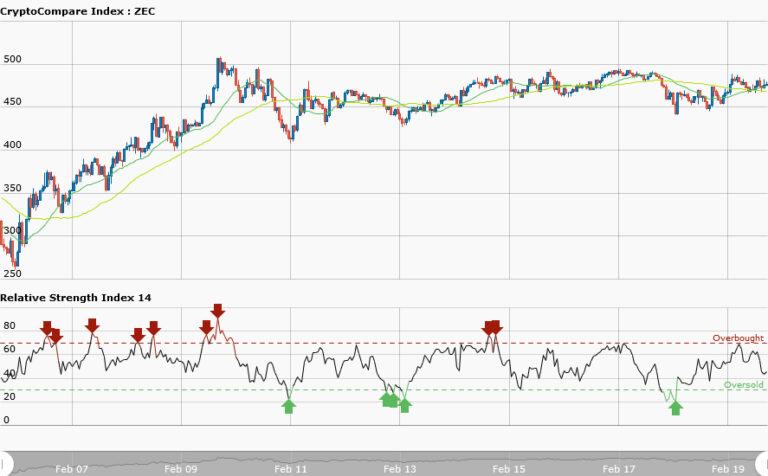
Yesterday, the market was in a sideways movement at a price of $476.58. Today, the sideways market continues at a price of $477.08. Meanwhile, the 50-day moving average and the 20-day moving average are trending sideways like a horizontal line whereas the RSI period 14 is level 43 which indicates that price has entered the sideways trend zone.The weekly chart is not tradable because the resistance and support levels are not at a good distance apart.
Traders may suspend trading.
ZECUSD Short-term Trend: Sideways

The shorter term trend is also a sideways market. From the daily chart, you can determine the resistance and the support levels with a trend line but the pair is not moving in a ranging pattern. The price is neither respecting resistance level at $485 nor the support level at $470. In order not to give your profits to the market you don’t trade a sideways market that is not discernible.
Meanwhile the 50-day moving average and the 20-day moving average are trending sideways whereas the RSI period 14 is level 48 which indicates that price has entered the sideways trend zone.


