

ZECUSD Medium-term Trend: Sideways
Supply levels: $510, $500, $490
Demand levels: $450, $460, $470
Last week the medium term trend of Zcash has been in sideways for many days. With respect to last Monday’s price of $463.94 and current price of $476.58 which is about 2.7% price increase.
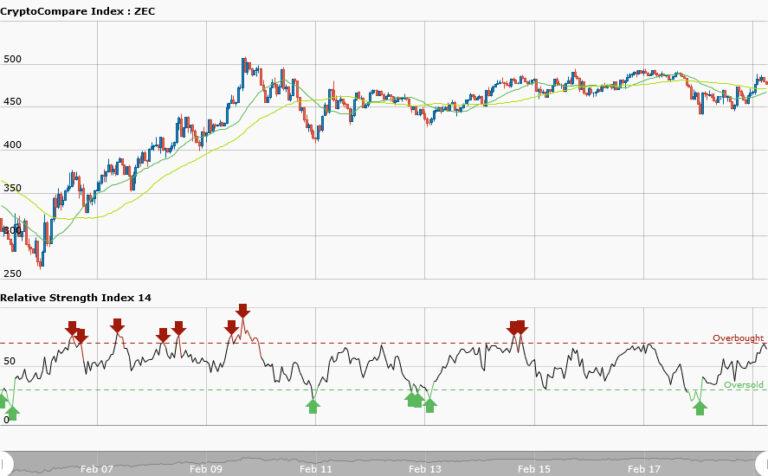
The weekly chart shows sideways trend like a horizontal line.This sideways movement may continue this week. However, the 50-day moving average and the 20-day moving average are trending sideways whereas the RSI period 14 is 68 indicating that price has reached thebullish trend zone
ZECUSD Short-term Trend: Sideways

Like yesterday, ZECUSD is trading in a sideways market. Today sideways market is tradable because the resistance and support levels are evenly apart. There are four trend lines namely two horizontal lines and two transverse lines.
The price at $470 is the resistance level while the price at $450 is the support level. If you catch the sideways trend at the beginning; you will have four trading opportunities. . At the resistance, you place a short trade in place of the arrows and exit near the support zone. In the same vein, you place a long trade at support and exit your trade near the resistance zone.


