

ZECUSD Medium-term Trend: Bullish
Supply levels: $600, $550, $500
Demand levels: $300, $350, $400
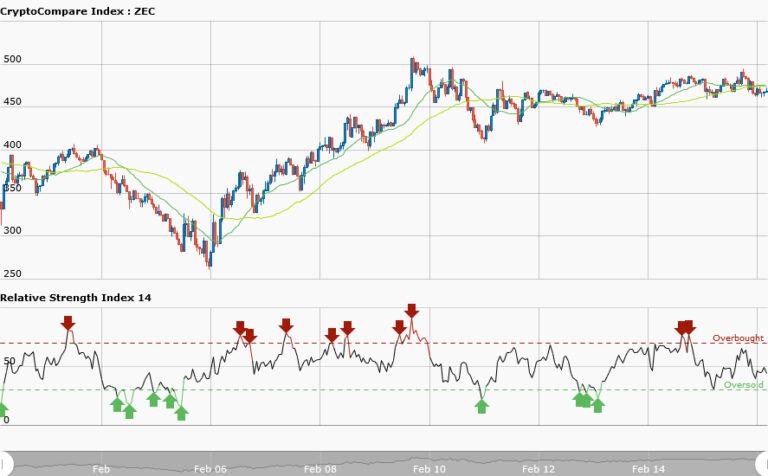
Today In the weekly chart, ZECUSD is in a bullish market trading at $468.87. However, the 20-day moving average is above the 50-day moving average indicating that the pair is rising. Also, the RSI period 14 is level 49 indicating that the price is in the bullish trend zone. This bullish trend zone may last for short, medium or longer time period. Traders should look for buy set up to place their long trades.
ZECUSD Short-term Trend: Bullish

Yesterday, on the daily chart ZECUSD was trading at $469.38 in a sideways market. As I said sideways market is tradable if you can determine the resistance and support levels and catch the sideways trend from its inception. Today the pair is still in a sideways market. From the daily chart, the price at $485 is the resistance level while the price at $470 is the support level.
These are the two levels where the price will be oscillating before a breakout. If you catch the sideways trend at the beginning; you will have six trading opportunities. At the resistance, you place a short trade in place of the arrows and exit near the support zone. In the same vein, you place a long trade at support and exit your trade near the resistance zone. The RSI period 14 is level 71indicating that the market is overbought.


