

ZECUSD Medium-term Trend: Sideways
Supply levels: $485, $480, $475
Demand levels: $455, $460, $465
Yesterday, ZECUSD was trading at $478.08 in a bullish market.Trading a trending market is more profitable than a sideways market. While in an uptrend, if a currency pair retraces from its recent high, it will create a support level where traders can go long. In other words, traders who wish to go long can enter a position when price pulls back.Today, ZECUSD is trading at $469.38 in a sideways market.
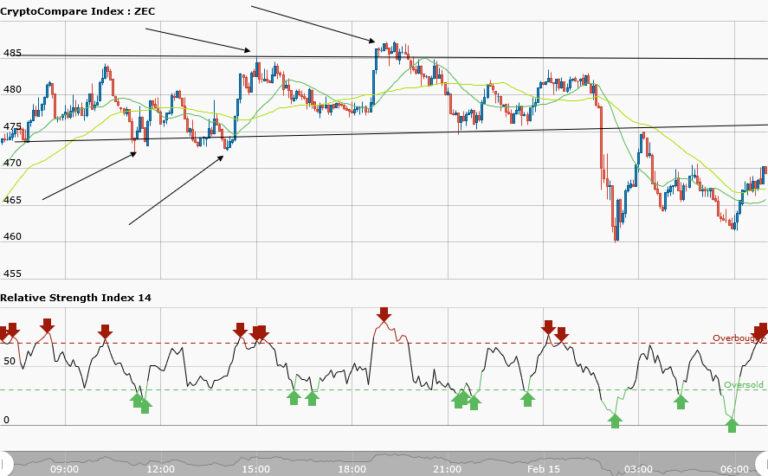
This sideways market is tradable if you can determine the resistance and support levels and catch the sideways trend from its inception. The price at $485 is the resistance while the price at $475 is the support. The price will be oscillating between these two ends before breakout.Therefore, you can place a short trade at the resistance level and exit near the support zone.
Similarly, you also place a long trade at the support and exit at the resistance zone. However, the RSI period 14 is level 71 indicates that the market is overbought.
ZECUSD Short-term Trend: Bullish

The short term trend is an uptrend, you just have to follow retracement and pull backs to trade. The RSI period 14 is level 50 indicating that average gains are higher than average losses.


