

ZECUSD Medium-term Trend: Bullish
Supply levels: $495, $490, $485
Demand levels: $460, $465, $470
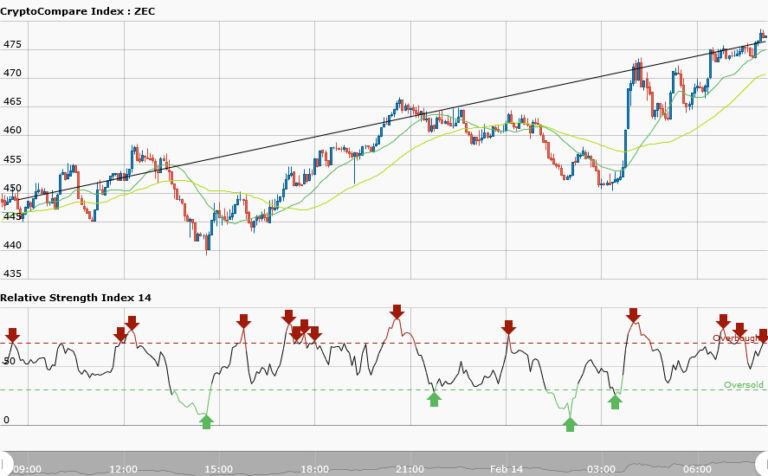
Yesterday, ZECUSD was trading at $450.62 in a sideways market. Today, the price has appreciated and risen to $478.08 which is about 6% price increase. In yesterday’s sideways market traders could profit from the market if they had followed the trend from its inception.ZECUSD pair is trading in an uptrend market.
To determine the market direction a trend line is drawn across the price bars. In an uptrend , a trend line is drawn across the price bars from the lower left corner of the chart to the upper right corner as shown in the chart; the line will overlap the price bars several times indicating a real trend. In a trend you can follow the familiar logic of buying low and selling high.
While in an uptrend, and if a currency pair retraces from its recent high, it will create a support level where traders can go long. In other words, traders who wish to go long can enter a position when price pulls back. The RSI period 14 is level 7o which indicates that the market is oversold.
ZECUSD Short-term Trend: Bullish

The short term trend is bullish. Also, the 50-day moving average and 20-day moving average are trending northward. Traders should watch and trade retracement and pull backs in a trending market.


