
ZECUSD Long-term Trend: Sideways
Supply levels: $600, $550, $500
Demand levels: $300, $350, $400
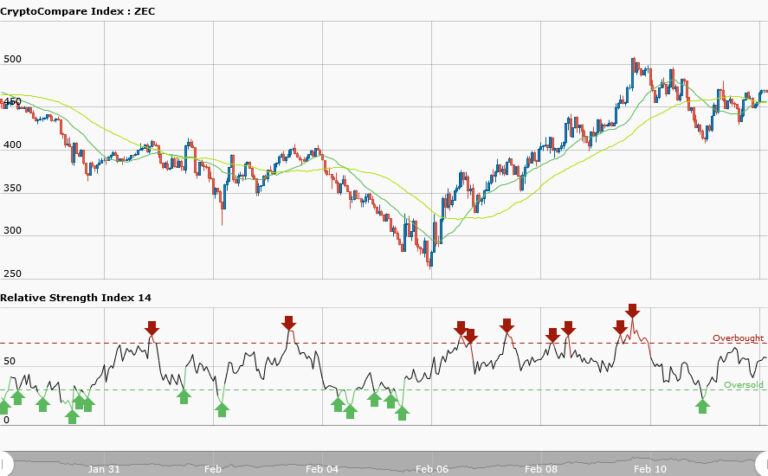
ZECUSD is trading at a price of $463.94 today. Last week the pair fell to a low of $260 but it has risen to a sideways movement. This week price will be fluctuating as against other crypto currency. However, RSI period 14 is level 58; that is any reading above 50 means that average gains are higher than average losses suggesting that bears would soon take over the market.
ZECUSD Medium-term Trend: Sideways

The medium term trend explains the sideways movement. Two trend lines have been drawn: the price at $430 and $440 are the support level while the price at $470 is the resistance level. Not all sideways market is tradable but you can place a long order at support level and a short order at the resistance level. Your take profit for short order is at the support zone while your take profit for long order is at the resistance zone.
The RSI period 14 is level 40. The price has declined and that losses are dominant. The 50-day moving average and 20-day moving average are trending sideways.


