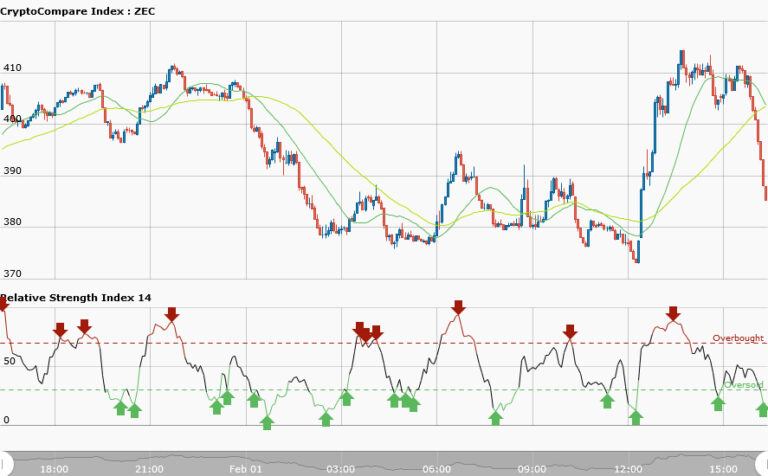
ZECUSD Medium-term Trend: Bearish
Supply levels: $410, $400, $390
Demand levels: $360, $370, $380
When you scroll backward you will find out that the ZECUSD pair has gap up early January 2018. The market was in a sideways movement before it gap up. Just like the LTCUSD pair a downtrend commenced after its sideways movement. In other words the gap will not be filled but the downtrend will continue until further notice. Therefore the bearish outlook may continue because a trend can take days, weeks or months before it reverses. The 50-day moving average (MA) and 20-day moving average are moving southward.
ZECUSD Short-term Trend: Bearish
The overall trend is bearish. However, on January 30, 2018 the market retraced at a price of $360 to $400 and breached at Fib retracement level of 38.2. In a downtrend, it is expected that if price retraces from the low, it will encounter resistance at one of the Fib retracement levels which will give traders the opportunity to short.
The principle behind price action is that if an exhaustive candlestick forms above or below a Fib retracement level, it gives you a confirmation that the level will hold for some time. However, traders can short at Fib retracement level in view of the bearish outlook.


