

XRPUSD Medium-term Trend: Bullish
Supply Levels: $1.05, $1.00, $0.95
Demand levels: $0.75, $0.80, $0.85
XRPUSD was trading at $0.7568 yesterday while in a sideways market. Today, the pair is trading at $0.8880 which is about 17.3% increase. If you check the February 8 analysis, the current bullish trend came into being as a result of XRPUSD pair breaking the support trend line to form a trend. The price appreciation was as a result of the current bullish trend from yesterday’s sideways trend.
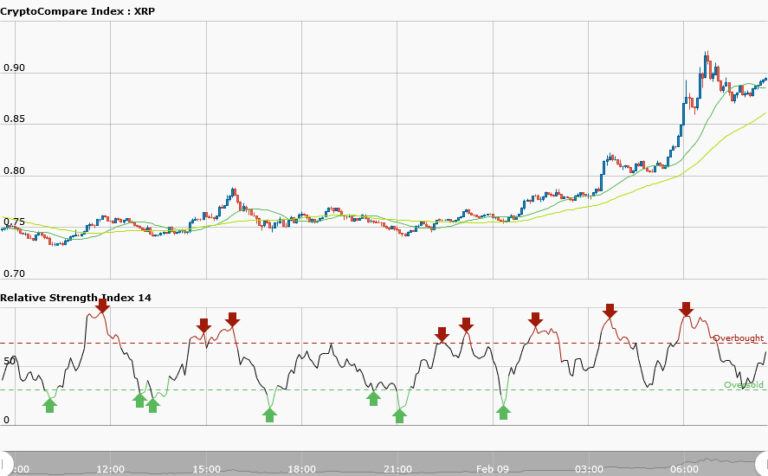
The 50-day moving average and 20-day moving average are trending upwards whereas RSI period 14 is level 77 indicating that the market is overbought. Price has risen above the support levels. Traders can take long trades at the support levels.
XRPUSD Short-term Trend: Bullish

Yesterday the short term trend was bearish and the demand levels were breached. Today the short term is bullish and XRPUSD pair has traded above the demand levels. Presently, the 50-day moving average and 20-day moving average are trending northward whereas RSI period 14 is in the overbought condition.
The RSI indicator is showing that price is falling because the market is overbought. If the trend has not reversed the price can rally at the overbought condition.


