

XRPUSD Medium-term Trend: Sideways
Supply Levels: $0.96, $0.95, $0.94
Demand levels: $0.90, $0.91, $0.92
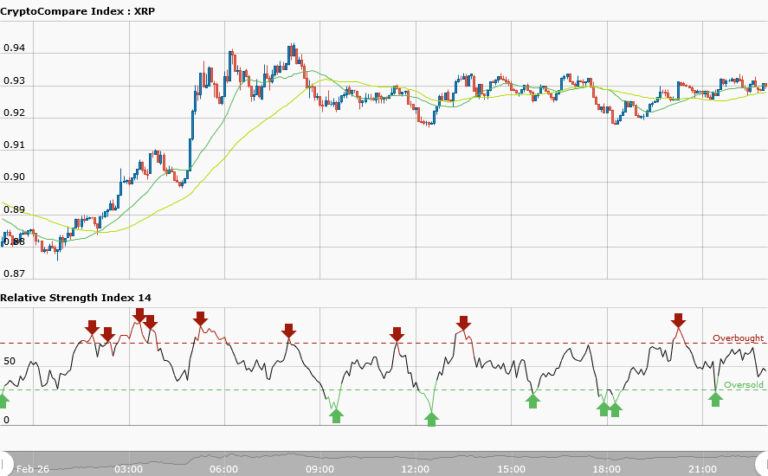
Ripple price has been in a sideways movement for some days.On the daily chart the pair has been trading horizontally. As a result of this sideways movement the price fluctuates. Today the pair is trading at $ 0.93 in a sideways market.The 50-day moving average and 20-day moving average are trending sideways whereas the RSI period 14 is level 48 indicates that price is in the sideways trend zone. Trading is unnecessary at this point in time.
XRPUSD Short-term Trend: Sideways

The XRPUSD pair is in a sideways market.This sideways market is a ranging market. The key levels of resistance and support are at a good distance apart. Traders should catch this sideways trend at its commencement and trade it. The price at $0.93 is the resistance level while the price at $0.92 is the support level and you short at the resistance where the price is testing that level.
Also, you take a long position where the price is testing the support level .For instance if you take a short trade at the resistance you exit near the support zone. Similarly, if you take a long trade at the support you exit near the resistance zone.


