

XRPUSD Medium-term Trend: Bearish
Supply Levels: $1.00, $0.98, $0.96
Demand levels: $0.88, $0.90, $0.92
Last week, XRPUSD pair has been in sideways a movement for many days with last Monday’s price at $1.12. Some of the sideways market has no trading range; that is the resistance and support levels which are the basis of technical analysis are so close and tight.Today, the pair is trading at $0.88 and has a bearish outlook because the moving averages are above the candlesticks.
However, the 50-day moving average and 20-day moving average are trending southward whereas RSI period 14 is level 33 indicates that the market has reached the oversold condition.The demand level s of the market will be breached. Traders are to look for buy setups to place long trades.
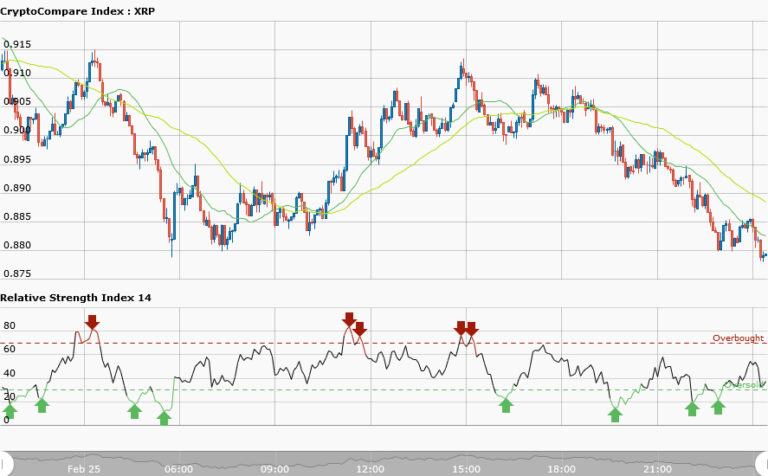
XRPUSD Short-term Trend: Bearish

The short term trend for ripple is bearish. The 50-day moving average and 20-day moving average are also trending southward whereas RSI period 14 is level 67 indicates that the market has reached the overbought condition of the market. However, RSI indicator diverges with the price trend; whereas price is in the downtrend; RSI period 14 is in the upper range of price. This is a strong signal that price reversal is imminent.


