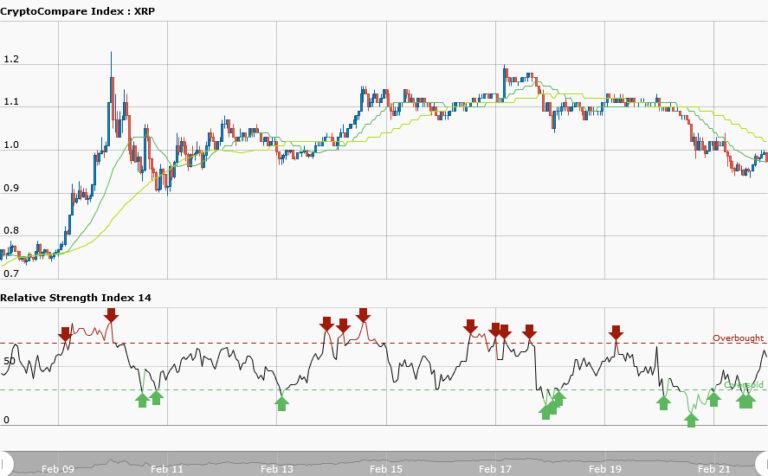

XRPUSD Medium-term Trend: Sideways
Supply Levels: $1.04, $1.02, $1.00
Demand levels: $0.92, $0.94, $0.96
Yesterday, XRPUSD pair is in a sideways market trading at $1.02. The sideways market is not ranging market which makes the price to fluctuate and declines.
Today the pair is trading at $0.98 and has fallen back to its tight range era. In retrospect, ripple has been trading in a tight range for the last two weeks of February, 2018(February 1 to February 14).However, the 50-day moving average and 20-day moving average are trending horizontally after the candlesticks whereas the RSI period 14 is level 62 indicating that the market is in the bullish trend zone; suggesting that bulls may take control of the market.
XRPUSD Short-term Trend: Sideways

The short term trend of ripple has been in a sideways movement since yesterday and today. The short term market is not tradable because of it’s choppy nature. The resistance and support levels are not discernible because the market is in a tight range. The price fell from $1.02 to $0.94 and started moving horizontally forming support levels before moving to the resistance level.
However, the 50-day moving average and 20-day moving average are trending sideways whereas the RSI period 14 is level 21 indicating that the market is oversold; suggesting that bulls may take control of the market.