

XRPUSD Medium-term trend: Bullish
Supply Levels: $1.15, $1.10, $1.05
Demand levels: $0.85, $0.90, $0.95
Yesterday it was reported that Ripple was under pressure but it continues to trade inside the range of $0.87 and $1.74. There were fears that if these levels were broken the demand levels of $0.80, $0.85,and $0.90 would be breached. Today, the price is trading in the range of $0.95 and there are prospects of its rise.
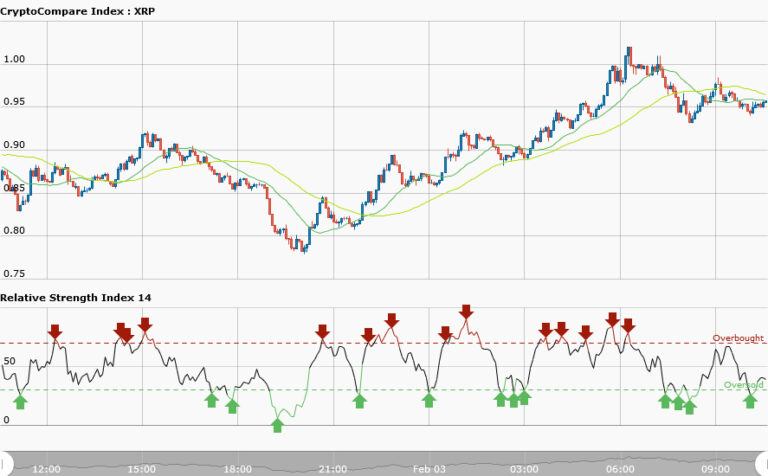
The 20-day moving average is above 50-day moving average indicating that price is rising and trending northward whereas RSI period 14 is level 45 indicating a sideways trend.
XRPUSD Short-term trend: Bearish

As reported on February 1, 2018 that the short term trend has a bearish outlook because the moving averages are trending towards the demand levels and that short term traders should find the trend on the 15-minute, 60-minute, and 240-minute charts to increase their probability of success.
Today the short term trend is still bearish because the 50-day moving average and 20-day moving average are trending southwards whereas the RSI period 14 levels 41 is indicating that the market is in a sideways movement. It is advisable to take your trades at the key levels of the market; that is trade at the demand and supply levels of the market.


