

XRPUSD Medium-term Trend: Bullish
Supply Levels: $1.16, $1.15, $1.14
Demand levels: $1.10, $1.11, $1.12
Last week the medium term trend of ripple has been sideways on many days. With respect to last Monday’s ripple price of $1.05 and current price of $1.12 which is about 6.6% price increase. The weekly chart is a bullish trend. However, the 20-day moving average is above 50-day moving average indicating that price is rising .
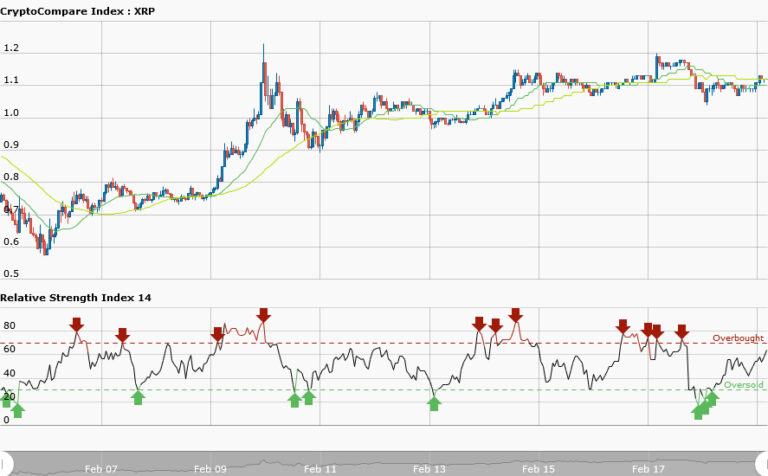
The RSI period 14 is level 61 indicating that price has reached the bullish trend zone. There are favorable news that Western Union one of the oldest money transfer companies has confirmed it is testing Ripple’s Blockchain based settlement system. This may enhance the current value of the crypto currency trading.
XRPUSD Short-term Trend: Bullish

Yesterday, in the daily time frame the pair is trading in a bullish market. A bullish market is where prices tend to move in upward direction. Since ripple price is rising then it is more likely to increase.
Traders are to look for buy setup to place their long trades.However, today RSI period 14 is level 66 indicating that the price is the bullish trend zone whereas the 50-day moving average and 20-day moving average are trending northward. Ripple may appreciate in value as long as the market remains bullish.


