

XRPUSD Medium-term Trend: Bullish
Supply Levels: $1.40, $1.30, $1.20
Demand levels: $0.80, $0.90, $1.00
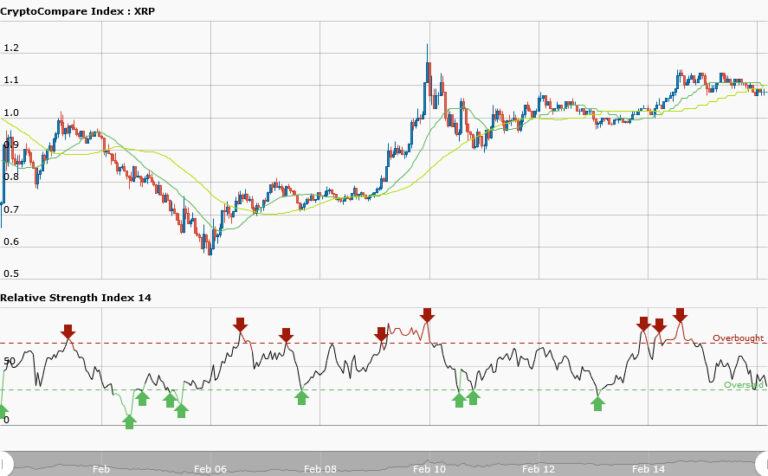
Yesterday, the XRPUSD is trading at $1.10 in a sideways market. Today, it is trading at $1.09 in a bullish market. However, the 20-day moving average is above the 50-day moving average indicating that the pair is rising. Also, the RSI period 14 is level 42 indicating that the price is in the bullish trend zone. As the price enters the trend zone, it could be short, medium or long duration.
As traders we are not bothered by the time duration of trend but to take advantage of price rise.
XRPUSD Short-term Trend: Bullish

Yesterday, XRPUSD was in a sideways movement. The pair was not tradable because the sideways market was choppy. A choppy market is one the resistance and support are in disarray. In other words a sideways market is one that the resistance and support is not evenly apart.Today in the daily time frame the pair is trading in a bullish market. A bullish market is where prices tend to move in upward direction.
Since ripple price is rising then it is more likely to increase traders are to look for buy setup to place their long trades.


