XRPUSD Medium-term Trend: Sideways
Supply Levels: $1.16, $1.14, $1.12
Demand levels: $1.04, $1.06, $1.08
Yesterday, XRPUSD was trading at $1.04 in a bullish market. Traders were advised to watch out for retracement or pull back in an uptrend so as to place long trades. Taking advantage of such retracement will give more profits when the market resumes its uptrend.The ripple price is presently trading at $1.10 in a sideways market. In a sideway market, traders should determine whether the resistance and support levels are even and not choppy.
The chart before us is not tradable. A choppy market should be avoided. Ripple price will be fluctuating as long as this sideway market last. The 50-day moving average and 20-day moving average are trending sideways.
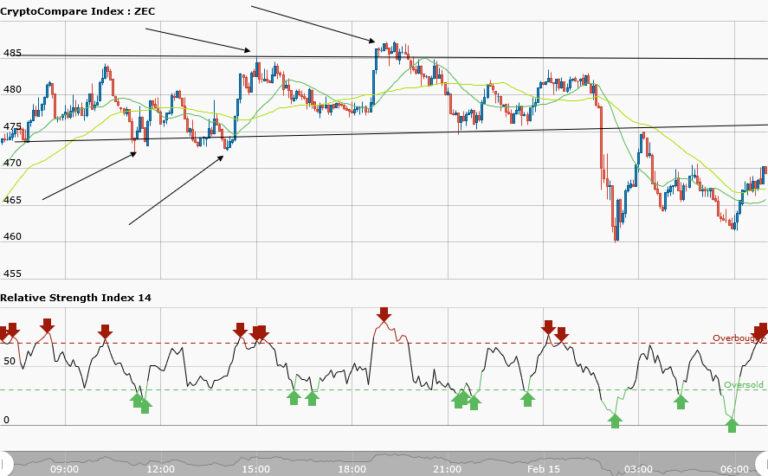
XRPUSD Short-term Trend: Sideways
Yesterday, in the short term trend the market was bullish and RSI is above level 70 which indicates that the market was overbought. I said the tendencies were there for you to close your long positions. Sometimes it would amount to premature decision. The proper thing is to wait for the bullish market to reverse or allow RSI to cross below level 70.Today, the short term trend is sideways.
The RSI period 14 is level 66 which is above 50 indicates that the average gains are higher than average losses.


