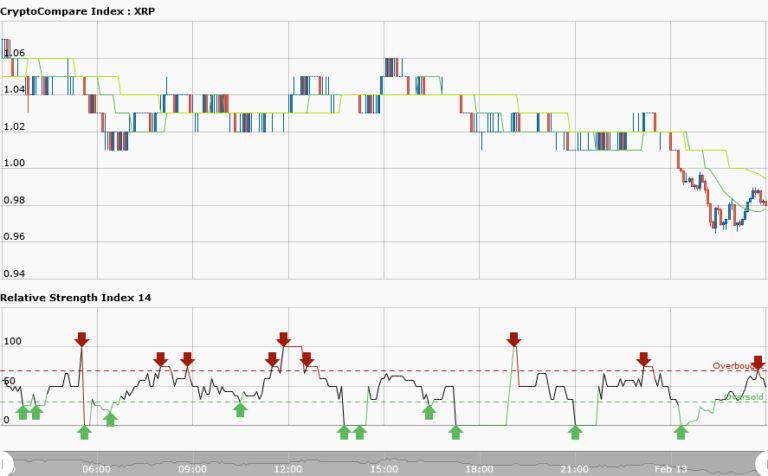
XRPUSD Medium-term Trend: Sideways
Supply Levels: $1.04, $1.02, $1.00
Demand levels: $0.92, $0.94, $0.96
XRPUSD was trading at $1.05 yesterday in a sideways market. Today the price has fallen to $0.98 which is about 16% fall in price. The fall in price was a result of his volatility and sideways movement. The 50-day moving average and 20-day moving average are trending sideways whereas the RSI period 14 is level 33 indicating that the market is oversold. Price has declined and selling pressure is being exhausted.
a result of the falling price the demand levels of $0.92, $0.94, and 0.96 have been breached. Traders should look for a buy set up to place a long trade.
XRPUSD Short-term Trend: Bearish
The short term trend is bearish. Presently, the 50-day moving average and 20-day moving average are trending southward. The XRPUSD pair has breached the demand levels of the market as a result of the falling price. Whereas RSI period 14 is above 50 indicating that the average gains are more than average losses suggesting that sellers would soon take control.
Traders should take trade decision on the direction of the market on the higher timeframe.


