

XRPUSD Long-term Trend: Sideways
Supply Levels: $1.40, $1.30, $1.20
Demand levels: $0.80, $0.90, $1.00
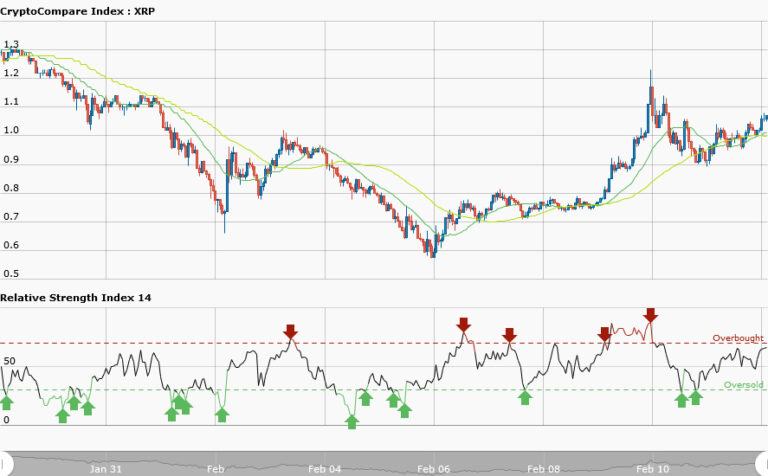
XRPUSD pair has been trading between the range of $0.87 and $1.07 since February 1, and last week. Today the pair is trading at $1.05. The long term trend is sideways. The XRPUSD pair sideways movement is very choppy. This week the sideways may continue. Traders have to suspend trading for now. However, the 50-day moving average and 20-day moving average are trending sideways whereas the RSI period 14 is level 65.
XRPUSD Medium-term Trend: Sideways

The XRPUSD pair is in a sideways movement. The pair has tradable set up. The support level is the price at $ 0.96 whereas the resistance level is the price at $1.02. The price tested the support twice and gives us two trading opportunities. We should place a long order when we have the signal at different times and take our profits near the resistance zone.
The price also tested the Resistance level twice and gives us two trading opportunities. We are to place short orders at different times when we have the signals and take our profits near the support zone. The RSI period 14 is level 25 indicating that the market is oversold that we place a long order.


