

XRPUSD Medium-term Trend: Bearish
Supply Levels: $1.05, $1.00, $0.95
Demand levels: $0.80, $0.85, $0.90
XRPUSD pair is in a downtrend. A trend line has been drawn which must touch two or more points on the chart. A downtrend is present when prices make a series of lower highs (LH) and lower lows (LL). In a downtrend, if prices retrace from a recent low, a resistance level would be created given traders the opportunity to short.
In trend trading, you can follow the familiar logic of buying low or selling high. However, according to news, Ripple is under pressure but it continues to trade inside the range of $0.87 and $1.74. There are fears that if these levels are broken then the demand levels of$0.80, $0.85, $0.90 would be breached.

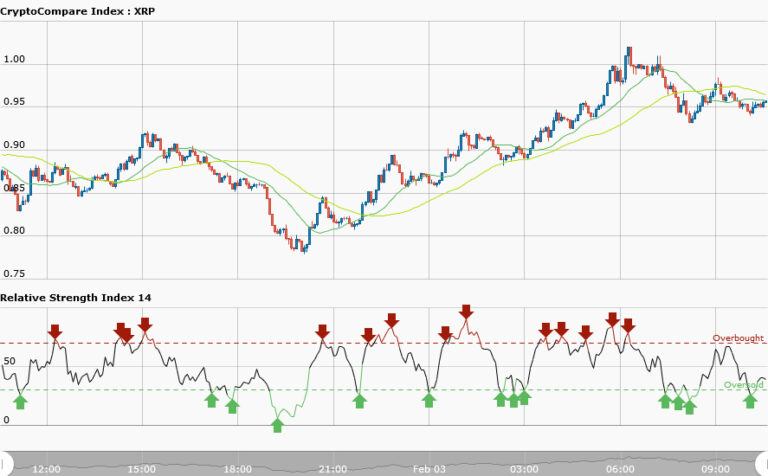
XRPUSD Short-term Trend: Bearish
In a short term trend intraday traders wants to find the trend on the 15-minute, 60-minute, and 240-minute charts to increase their probability of success. However, the 50-day moving average and 20-day moving average still gives a bearish signal and its tending towards the demand level. In addition the RSI indicator has indicated that price has reached the oversold condition.


