

LTCUSD Medium-term Trend: Sideways
Resistance: $160, $158, $156
Support: $148, $150, $152
LTCUSD pair is trading in a sideways market today as per the daily chart. Yesterday, it was trading at $148.77 but now in the range of $154.87 which is about 4% increase. Litecoin and Ethereum has the same price pattern.
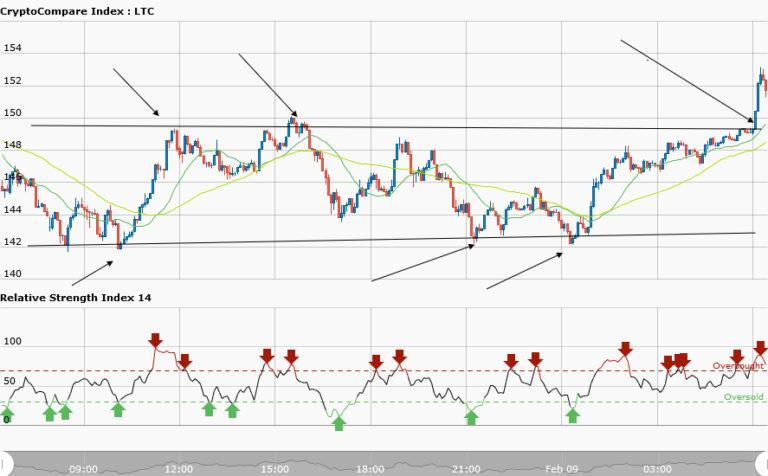
The LTCUSD pair chart is drawn: the upper trend line is the resistance level while the lower trend line is the support level. The three arrows at the lower trend line are possible positions where you can place long orders. Your take profit should be at the resistance zone; but sometimes the price will not get to the zone and reverse.
The two arrows at the resistance are possible positions where you can place short orders. Your take profit should be at the support. The last arrow at the resistance is where the price broke the trend line. It is possible the pair will form a new trend and end the sideways movement. The RSI period 14 is level 83 indicating that the market is in an overbought condition.
LTCUSD Short-term Trend: Bullish

The short term trend is bullish. The 50-day moving average and 20-day moving average are trending northward whereas the RSI period 14 is level 77 indicating that the market is overbought.


