

LTCUSD Medium-term Trend: Bullish
Resistance: $180, $170, $160
Support: $120, $130, $140
Yesterday the market was in a downtrend and price fell to as low as $112.70. However there was a pull back from the low which took the price to as high as $136 before it began to fall back again. The pull back was as a result of strong buying interest from the bulls at the lower levels.
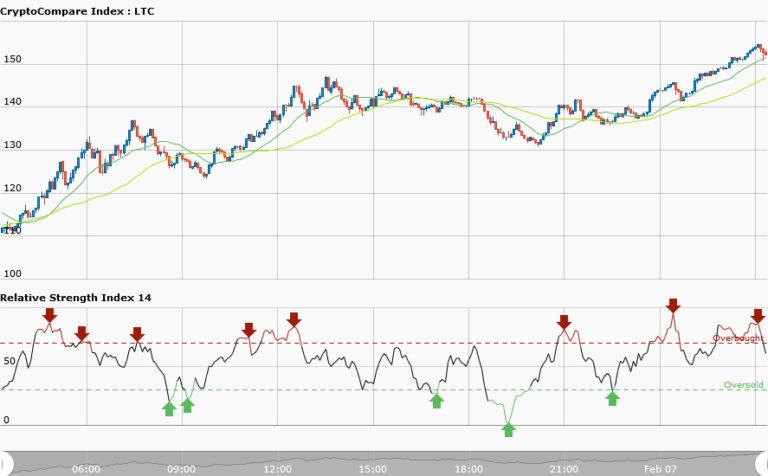
However, today the LTCUSD pair is trading at $150.77 which is about 33% price appreciation from yesterday. The 50-day moving average and 20-day moving are trending northward whereas the RSI period 14 is level 69 which indicate a bullish trend. Since the bulls have strong buying interest at the lower levels they should take advantage of the buy setup to take long trades.This invariably will take them out of the support levels.
LTCUSD Short-term Trend: Bearish

The short term trend market is bearish but the overall trend is bullish in the longer time frame. The market is retracing from the low which invariably will lead to the bullish trend. The 50-day moving average and 20-day moving average are trending northward .Therefore short time traders can take long trades in anticipation of a bullish trend.


