

LTCUSD Medium-term Trend: Sideways
Resistance: $235, $230, $235
Support: $205, $210, $215
The LTCUSD pair is trading in a sideways market as it was yesterday. It is one of the most stable and stronger crypto currencies when compared with other top coins. Presently, it is trading at $222.25 which was the previous price of litecoin a week ago. The sideways market is not tradable because of its choppy price action.Traders should not trade this sideways market which is horizontal or flat because of the absence of trading range.
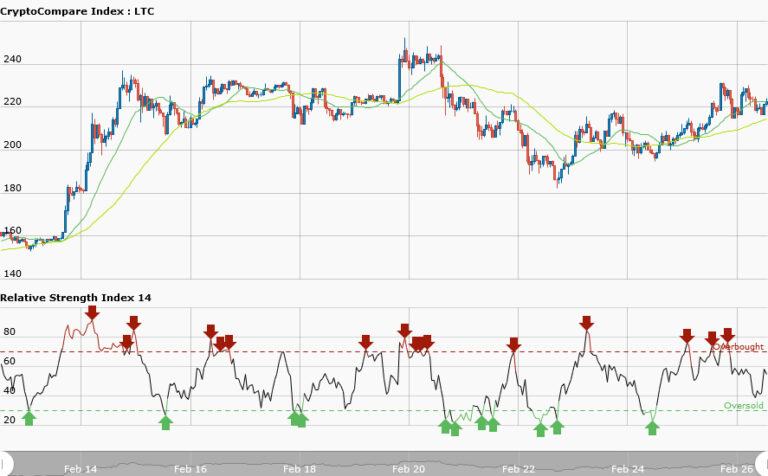
In otherwords, there is no trading range between the resistance and support levels. The 50-day moving average and 20-day moving average are trending horizontally whereas the RSI period 14 is level 58 indicating that the average gains are higher than average losses.
LTCUSD Short-term Trend: Sideways

The LTCUSD pair is in a sideways market. This sideways market is a ranging market. The key levels of resistance and support are at a good distance apart. Traders should catch this sideways trend at its commencement and trade it. The price at $230 is the resistance level while the price at $215 is the support level and the arrows are the positions where you can either take a short or long trades.
For instance if you take a short trade at the resistance level you exit near the support zone. Similarly, if you take a long trade at the support level you will exit near the resistance zone.


