

LTCUSD Medium-term Trend: Bullish
Resistance: $280, $260, $240
Support: $160, $180, $200
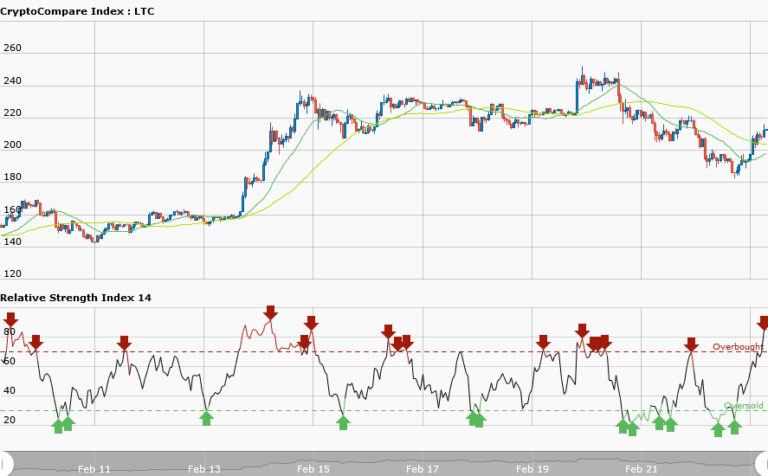
LTCUSD pair has been in a sideways market for sometimes but the pair has a bullish trend.The price has been fluctuating in a sideways market which results to its decline in recent times. Presently, it is trading at $212.84 and it is stronger when compared with other top coins. The 50-day moving average and 20-day moving average are forming bullish crossover whereas the RSI period 14 is level 84 indicating that the market is oversold.
LTCUSD Short-term Trend: Bullish

In the short term trend, LTCUSD pair is in a bullish trend. The bullish trend commenced at price level of $185 where it tested the support level twice and soar higher. The price of litecoin will continue to rise as long as the market is bullish. Traders can profit in the uptrend movement. First recognize that you are in uptrend. An uptrend is when prices make a series of higher highs (HH) and higher lows (HL).
Secondly, in an uptrend the market will always retrace back to the previous swing point and then bounce higher to resume the uptrend. These are swing point to lookout for to place your long trades. Thirdly, you can follow the familiar logic of buying low and selling high


