

LTCUSD Medium-term Trend: Sideways
Resistance: $230, $225, $220
Support: $200, $205, $210
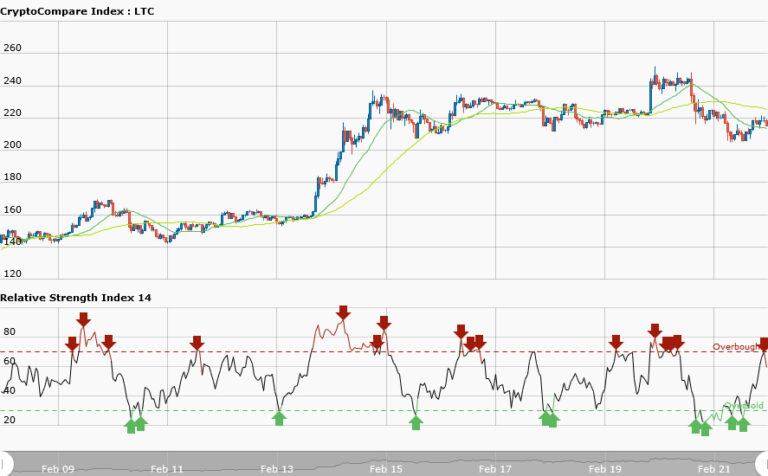
Today, the LTCUSD is trading at $214.09. The price has been fluctuating in a sideways market which results to its decline in recent times. The 50-day moving average and 20-day moving average are trending sideways. Although the 20-day moving average is below the 50-day moving average indicating litecoin’s price fall.The RSI period 14 is level 60 indicating that price has entered the bullish trend zone.
Yesterday, the pair has been in sideways movement and weekly chart showed litecoin to be in a choppy market. It is choppy because the key levels of resistance and support are so close without giving price the room to oscillates in between the key levels. It is sideways because the weekly chart shows price to be moving horizontally. Therefore traders were advised to suspend trading.
LTCUSD Short-term Trend: Sideways

In the short term trend, the daily chart prices are moving horizontally at the support level and other times only at the resistance level. This is not a ranging market that is tradable. However, the RSI period 14 is level 26 indicates that the market is oversold suggesting bulls to take control of the market.


