

LTCUSD Medium-term Trend: Sideways
Resistance: $245, $240, $235
Support: $215, $220, $225
The LTCUSD pair has been in sideways market since February 16, as it moves horizontally on the weekly chart. It closed yesterday at a price of $223.58 but opened with a price of $231.64 today. The issue is that the LTCUSD pair is in a sideways and choppy market. It is sideways because the weekly chart shows price to be trending horizontally.
It is choppy because the key levels of resistance and support are so close without giving price the room to oscillates in between the key levels.However, the 50-day moving average and 20-day moving average are trending horizontally portraying the sideways movement of the candlesticks. The RSI period 14 is level 39 indicating that the market is in the oversold region
LTCUSD Short-term Trend: Sideways

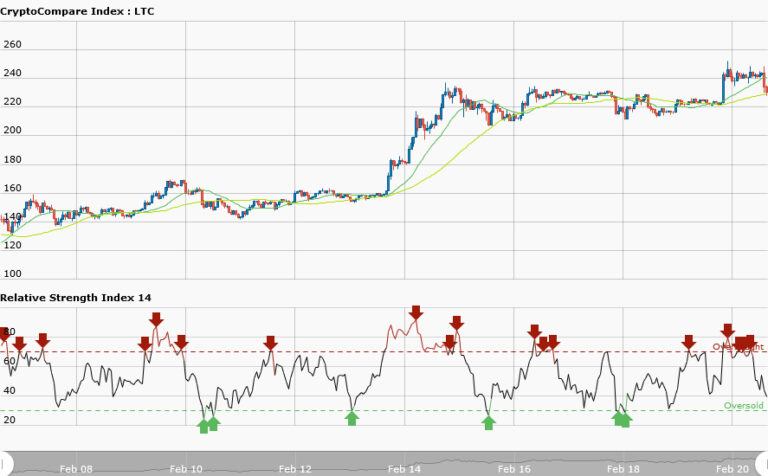
The weekly chart and daily chart have the same candlestick illustrations.Though daily chart has price spike and detailed candlestick information. The two charts are not tradable because of the closeness of the key levels; that is price has no room to oscillate.For you to trade sideways market it must be ranging. That is the price must oscillates to the resistance and support evenly and there must be a good distance between the key levels.
However, the RSI period 14 is level 30 indicates that the market is oversold.


