

LTCUSD Medium-term Trend: Sideways
Resistance: $230, $228, $226
Support: $218, $220, $222
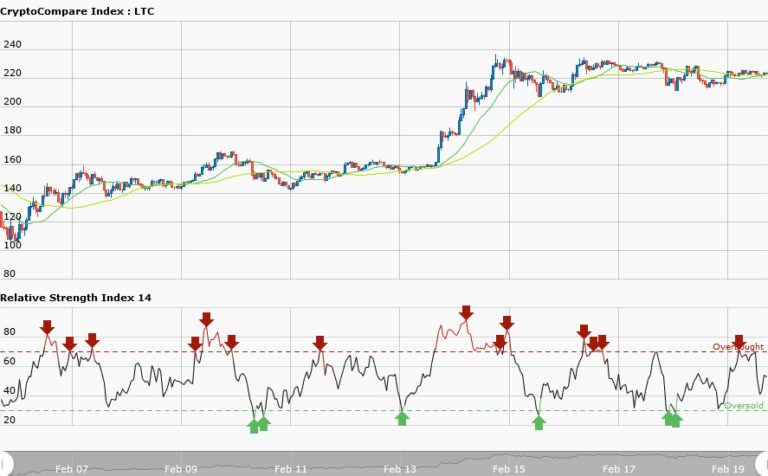
The LTCUSD is still trading in a sideways movement. Yesterday‘s price of $222.06 has risen to $223.58. The 50-day moving average and 20-day moving average are moving horizontally portraying the sideways movement of the candlesticks. The RSI period 14 is level 54 indicating that the average gains are higher than the average losses.
Traders should not trade the litecoin because of the choppy market. Most traders unconsciously give back their profits while trading such markets.
LTCUSD Short-term Trend: Sideways

LTCUSD is still trading in a sideways market as it was yesterday. Today the sideways market is still choppy. Traders may not have the opportunity of trading the market. In the short term trend, daily chart shows litecoin in a choppy market. The key levels of resistance and support are not evenly apart where the price can oscillates; this makes trading difficult.
The 50-day moving average and 20-day moving average are trending sideways whereas RSI period 14 is level 38 indicating that the price has reached the oversold region.This suggest that the bulls will take over from the bears at the oversold region.


