

LTCUSD Medium-term Trend: Bullish
Resistance: $235, $230, $225
Support: $205, $210, $215
Last week the medium term trend of LTCUSD has been bullish on many days. With respect to last Monday’s litecoin price of $152 and current price of $222.06 which is about 46% price increase today.
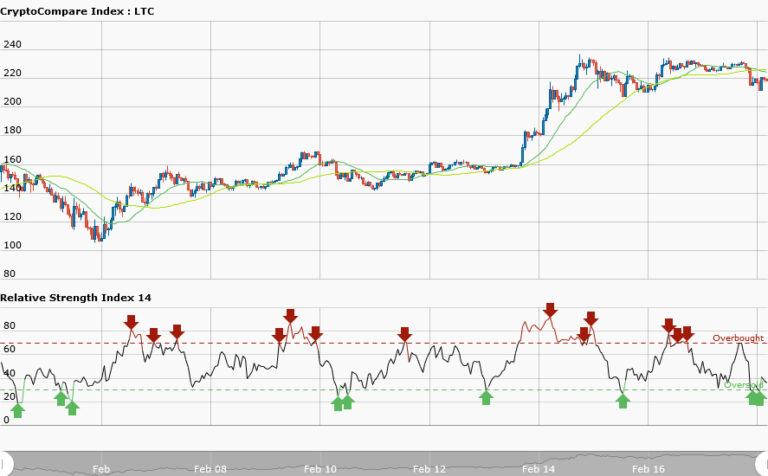
The weekly chart is in a bullish trend. However, the 20-day moving average is above 50-day moving average indicating a bullish trend; whereas RSI period 14 is level 38 indicating that price has reached the oversold condition suggesting that bulls may take over the market. Price will rise as long as the market remains bullish.
LTCUSD Short-term Trend: Sideways

On February 16, LTCUSD was in a sideways movement. The resistance and the support levels of the sideways trend were evenly apart where the price oscillated. Traders could profitably trade the sideways trend if they had commenced trading at the beginning of the trend . However, in today’s daily chart the sideways trend continues but it is choppy.
The key levels are not evenly apart where the price can oscillates; this makes trading difficult. The 50-day moving average and 20-day moving average trending is not discernible whereas RSI period 14 is level 36 indicating that price has reached the oversold condition suggesting that bulls may take over the market. Traders can suspend trading in the meantime.


