

LTCUSD Medium-term Trend: Bullish
Resistance: $280, $260, $240
Support: $160, $180, $200
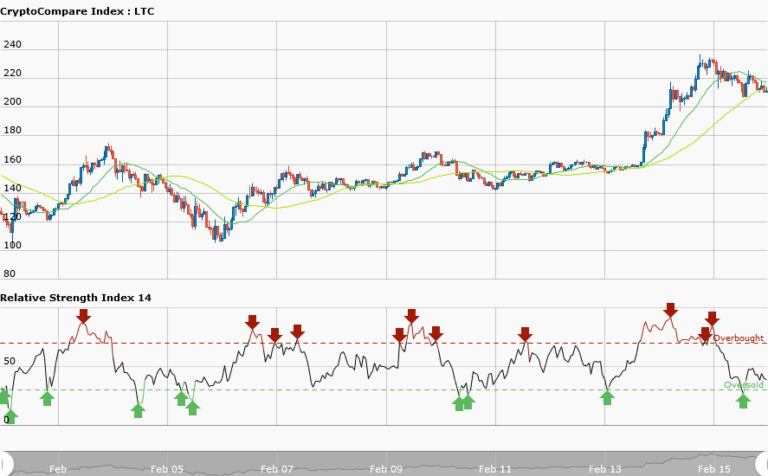
In the medium term trend the market has been sideways for the past previous days. However, the 20-day moving average is above 50-day moving average indicating a bullish trend; whereas RSI period 14 is level 48 indicating that price has reached the bullish trend zone.
LTCUSD Short-term Trend: Sideways

LTCUSD was in a bullish market trading at $226.11 and I said the price will rise as long as the market remains bullish. That in an uptrend the market will always retrace back to the previous swing point and then bounce higher to resume the uptrend. These are swing points to lookout for to place your long trade.Today, LTCUSD is in a sideways market trading at $211.39 which is about 6.5% fall in price.
The fall in price was a result of change in its uptrend movement to sideways movement. In the daily time frame, the price at $225 is the resistance level while the price at $210 is the support level. The price will be oscillating between these two ends before breakout. Therefore, you place a short trade at each of the arrows at the resistance level and exit near the support zone.
Similarly, you place a long trade at each of the arrows at the support level and exit at the resistance zone. However, the RSI period 14 is level 75 indicating that the market is overbought suggesting that bears may take control.


