

LTCUSD Medium-term Trend: Bullish
Resistance: $230, $220, $210
Support: $170, $180, $190
Yesterday, LTCUSD was in a sideways market trading at $157.63 but today price has appreciated to $197.18 which is about 25% price increase. In yesterday’s sideways market traders were told that they would have gotten four trading opportunities if they had followed the trend from its inception.Today, litecoin is trading in a bullish market. It has the best price appreciation as against other crypto currencies because the pair moved from $158 to almost $200.
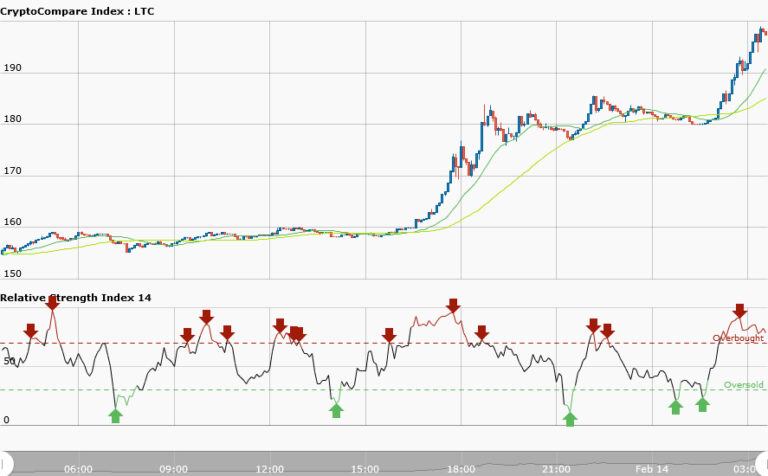
However, the 50-day moving average and 20-day moving average are trending northward whereas the RSI period 14 is level 81 indicating that the market is overbought. When the price action shows a price reversal candlestick then traders can take short trades. On the other hand if the uptrend has no price action signal then traders can go long. If the trend has not ended the price can rally at overbought market condition for days or weeks.
LTCUSD Short-term Trend: Bullish

In the short term trend the market is bullish. However, the 50-day moving average and 20-day moving average are trending northward whereas the RSI period 14 is level 35 indicating that the market is oversold. The RSI diverges with price trend; when price is rising,and RSI is in the lower range. This means that there is an impending reversal in price. Short term traders should not go long.


