

LTCUSD Medium-term Trend: Sideways
Resistance: $164, $162, $160
Support: $152, $154, $156
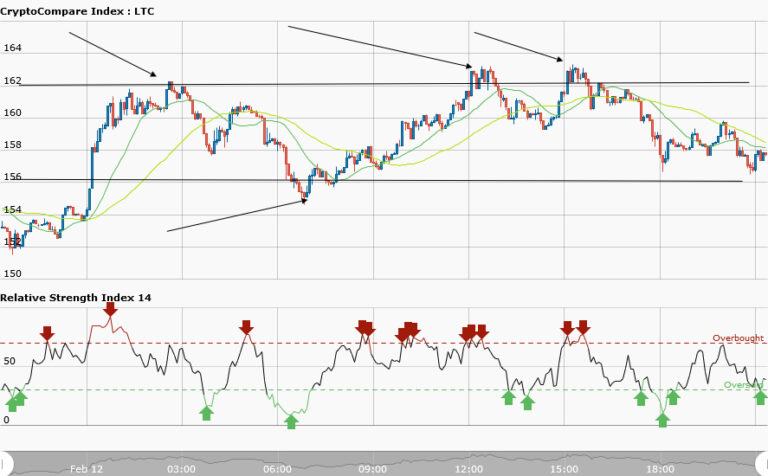
LTCUSD pair was trading at $152 yesterday in a sideways market.Today, litecoin is trading at $157.63 which is about 3.7% price increase. . From the chart the resistance level is the price at $162 while the support level is the price at $156. The price tested the resistance three times while the support level once. That is traders have four trading opportunities if trading commenced at the beginning of this sideways trend.
At the resistance level and at every signal you take a short trade and close this position near the support zone for profits. Similarly, at the support level and at every signal you take a long position and close this trade near resistance zone for profits. However, the 50-day moving average and 20-day moving average are trending sideways whereas the RSI period 14 is level 39 indicating that the market is oversold.
LTCUSD Short-term Trend: Sideways

The short term trend is in a sideways. The 50-day moving average and 20-day moving average are trending sideways whereas the RSI period 14 is level 35 indicating that the market is oversold. Traders are to take long traders.


