

ETHUSD Medium-term Trend: Sideways
Resistance: $860, $850, $840
Support: $800, $810, $820
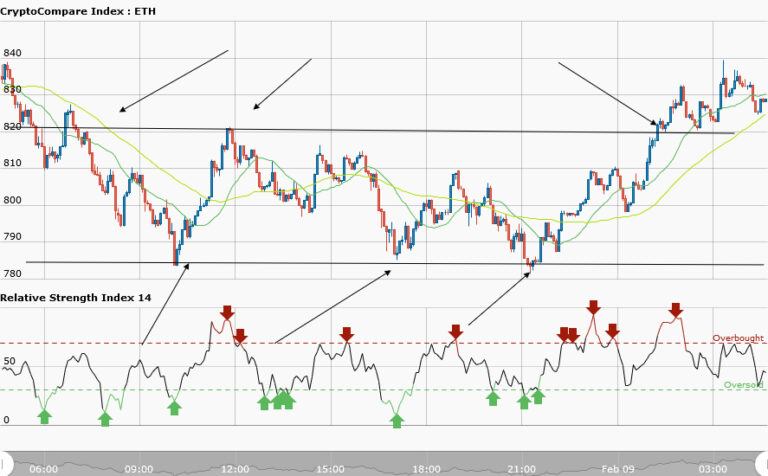
The medium term trend is a sideways market as shown by the daily chart. Yesterday, ETHUSD was trading at $821.59 but presently trading at $828.25 which is about 0.8% increase. The ETHUSD pair chart is drawn: the upper trend line is the resistance level while the lower trend line is the support level. The three arrows at the lower trend line are possible positions where you can place long orders.
Your take profit should be at the resistance zone; but some times the price will not get to the zone and reverse.
The two arrows at the resistance level are possible positions where you can place short orders. Your take profit should be at the support zone. The last arrow at the resistance level is where the price broke the trend line. It is possible the pair will form a new trend and end the sideways movement. The RSI period 14 is level 51 indicating that the average gains are more than the losses suggesting selling pressure may arrive soon.
ETHUSD Short-term Trend: Sideways

The short term trend is also sideways. The RSI period 14 is level 44 indicating that the market is in a sideways movement. It is not advisable to trade a sideways market but you can if the sideways market is not choppy.


