

ETHUSD Medium-term Trend: Sideways
Resistance: $895, $890, $885
Support: $860, $865, $870
Yesterday, ethereum was trading at $871.82 but today the price is at $874.36 which is about 0.29% price increase. Unlike bicoin , ethereun has no appreciable movement with respect to its percentage increase. Today, ETHUSD is in a sideways market although the market has choppy price action.The price is oscillating between the levels $885 which is the resistance level and $870 which is the support level.
Now if the price gets to the level of $870 traders can take a long position and exit the near the resistance zone. On the other hand if the price gets to the level of $885 traders can take a short position and exit near the support zone. If the price decides to breach the resistance level of $885; then ethereum will reach its previous high of $950.
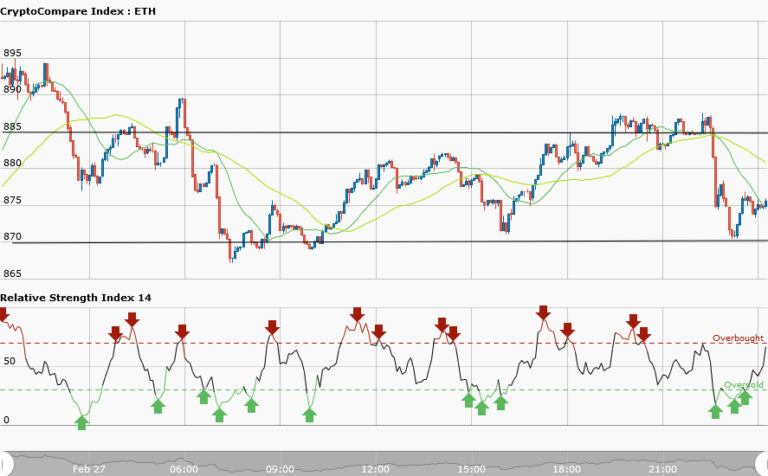
However, the RSI period 14 is level 67 indicates that the price is in the bullish trend zone.Also, that the average gains are higher than the average losses.
ETHUSD Short-term trend: Bullish

The short term trend is a bullish market because the moving averages are below the candlesticks. Secondly, 50-day moving average and the 20-day moving average are moving northward whereas RSI period 14 is level 76 indicates that the market has reached the overbought condition. If the price does not rally at the overbought condition then bears would take control of the market.


