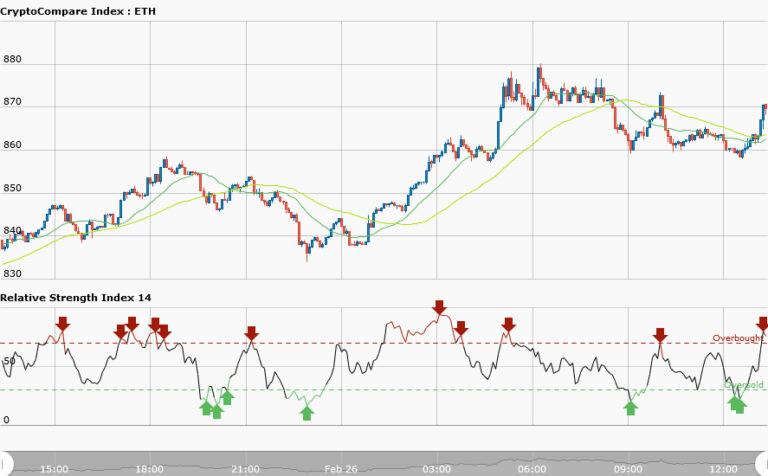
ETHUSD Medium-term Trend: Bullish
Resistance: $900, $890, $880
Support: $840, $850, $860
In the early hours of Monday 26, ETHUSD pair was trading at $821.64. Most of the crypto currencies fell as a result of the bearish reversal of Friday 23, 2018. On February 26, ethereum from its recent low of $840 broke through the support level to its recent high of $880. The pair is still trading at $871.82 in a bullish market. However, the 50-day moving average and 20-day moving average are moving northward.
While the RSI period 14 is level 79 indicating that the market is overbought suggesting that bears would take control of the market. If the market remains bullish the pair will breach the resistance level.
ETHUSD Short-term trend: Bullish
The short term trend is a bullish market because the moving averages are below the candlesticks. Secondly, 50-day moving average and the 20-day moving average are moving northwards whereas RSI period is level 64 indicates that the market is in the bullish zone.Traders are to follow the familiar logic of buying low and selling high. And to wait for retracement or pull backs in the uptrend so as to place your long trades.


