

ETHUSD Medium-term Trend: Bearish.
Resistance: $880, $860, $840
Support: $760, $780, $800
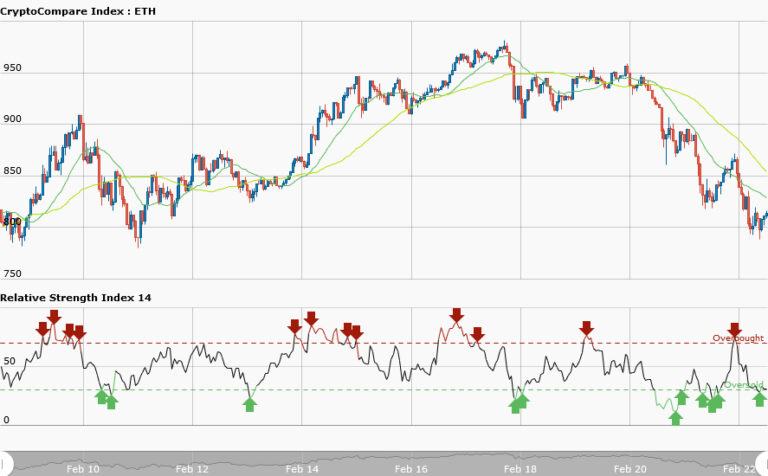
Yesterday, February 22, ETHUSD was trading at $866.57 but as of writing it is $821.47 today. The assumptions of yesterday’s post were that if the bulls break through the resistance level the price may continue to rise but if the bears breached the demand levels then price will fall below $800. However, 50-day moving average and the 20-day moving average are trending southward.
While RSI period 14 is level 31 indicating that the market is oversold suggesting bulls takeover of the market. Since the market is oversold traders can take a long position and exit when the bull market is exhausted.
ETHUSD Short-term trend: Bearish.

ETHUSD pair has a bearish outlook. Its price has fallen from $866.57 to $821.47 .However, the 20-day moving average is above the 50-day moving average and are trending southward whereas RSI period 14 is level 73 indicating that the market is overbought.However, the market reversed from its recent high of $860 to $800 where support level was created.
The support level has been tested by price action thrice. Traders can take a long position because the bullish trend has commenced.


