

ETHUSD Medium-term Trend: Sideways
Resistance: $900, $890, $880
Support: $840, $850, $860
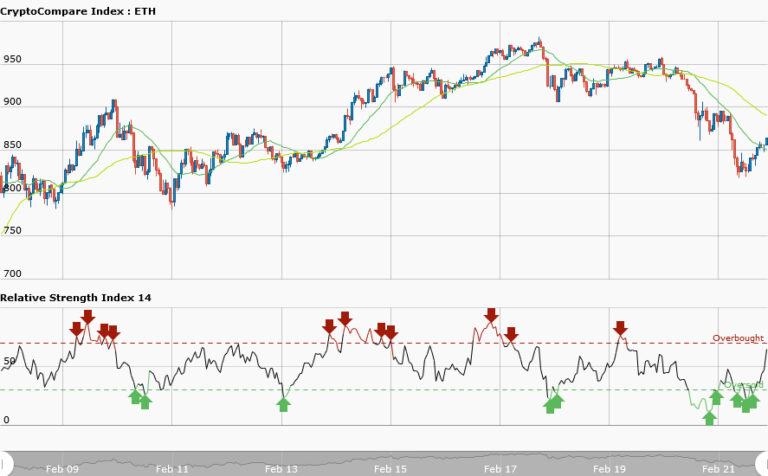
Yesterday, ETHUSD pair was trading at $895.60 but today price has fallen to $866.57.The assumption yesterday was that if the bulls break through the resistance level the price may continue to rise but if the bears breached the demand levels then price will fall below $800.Now the 50-day moving average and the 20-day moving average are trending sideways whereas RSI period 14 is level 64 indicating that the market is in the bullish trend zone.
However, if the market remains bullish consistently as per the RSI indicator bulls will dare the resistance level.
ETHUSD Short-term trend: Bullish

Yesterday, the daily chart had a bearish outlook. The RSI period 14 indicator informs us that the market was oversold suggesting that bulls will take over the markets.
Yesterday the price fell from a high of $890 to $820 and the bulls took the price to $866.57. That is why we have a bullish trend. However, the 50-day moving average and the 20-day moving average are trending northward whereas RSI period 14 is level 77 indicating that the market is over overbought suggesting bears takeover of the market.The resistance levels may be breached


