

ETHUSD Medium-term Trend: Bullish
Resistance: $980, $970, $960
Support: $920, $930, $940
Yesterday, ETHUSD was in a bullish market at a price of $937.72. It is in a smooth uptrend currently at a price of $947.92. Traders can follow the familiar logic of buying low and selling high. Secondly, in an uptrend if a currency retraces from the recent high it will create support level. Traders who wish to go long can take a position when the price pulls back to its support level.
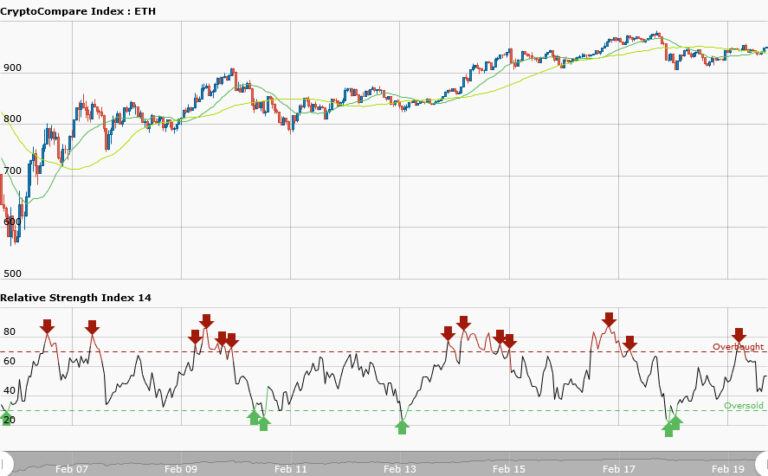
Meanwhile, the 50-day moving average and the 20-day moving average are trending northward whereas RSI period 14 is level 53 suggesting that average gains are higher than average losses.
ETHUSD Short-term trend: Sideways

In the shorter term trend, the daily chart is in a sideways movement. The resistance and support levels are not evenly apart. Traders may not be able to trade this sideways market because you cannot determine the key levels. Meanwhile, the 50-day moving average and the 20-day moving average are trending sideways whereas RSI period 14 is level 86 indicating that the market is overbought. And the bears would soon take possession of the market.


