
.
ETHUSD long-term trend: Bullish
Resistance: $1,040, $1,020, $1000
Support: $920, $940, $960
Yesterday, the attempted rise of Ethereum was short-lived despite its rating above other crypto currencies. The long term trend is bullish and price has fallen to $934.48.The pull back from the lows resulted to bullish movement. The 50-day moving average and 20-day moving average are trending northwards whereas the RSI indicator period 14 is below level 60; which explains that the market is a bullish trend.
That is, you can take long position at the support level and short at resistance level. However, if the resistanc levels of $1000 or $1,040 are breached then short trades may be recommended.
ETHUSD short-term trend: Bullish

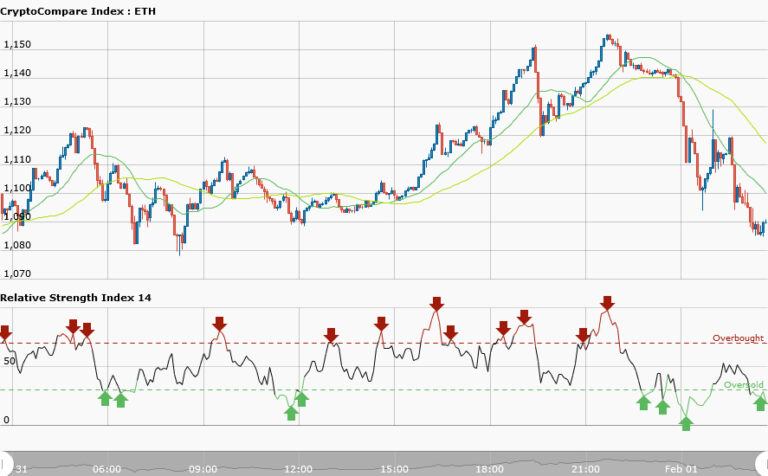
Yesterday in the short term trend price was rising before the appearance of a pin bar. The long pin bar is a reversal candlestick that makes the price to reverse or retrace from the lows. Today, the price retraced to about $1000 from the lows and commenced a bullish movement.The 50-day moving average and 20-day moving average (MA) are trending northward.
In the short term trend the RSI period 14 is above 70; indicating that the market is on the oversold condition. Traders can buy at the support levels.


