

ETHUSD Medium-term Trend: Bullish
Resistance: $960, $940, $920
Support: $900, $910, $920
Last week the medium term trend of ethereum has been bullish on many days.
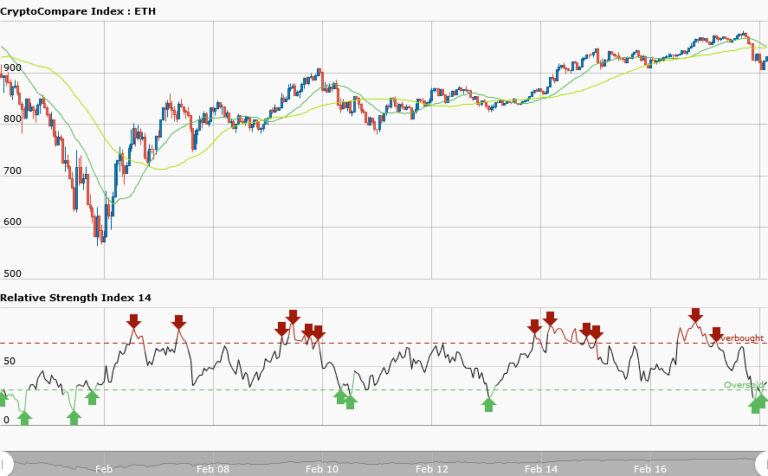
With respect to last Monday’s ethereum price of $829.32 and current price of $937.72 which is about 13% price increase today. The weekly chart is in a bullish movement because 20-day moving average is above 50-day moving average whereas the RSI period 14 is level 34 suggesting that the market is oversold which will invariably will bring in the bulls
ETHUSD Short-term trend: Bearish

In the shorter term trend the daily chart is in favor of the bears; because the 20-day moving average is below the 50-day moving average and trending southward. The price in the bearish trend has a retracement from the low at $910 which is one of the demand levels of the market. If you have the Fibonacci retracement tool we will apply it to this downward.
In a downtrend, it is expected that if prices retrace from the low, it will encounter resistance at one of the Fib retracement levels which will give traders the opportunity to short. Later the market will resume its downward movement. The RSI period 14 is level 73 indicating that the market is in the overbought condition suggesting that bears will soon take control.


