

ETHUSD Medium-term Trend: Sideways
Resistance: $880, $870, $860
Support: $820, $830, $840
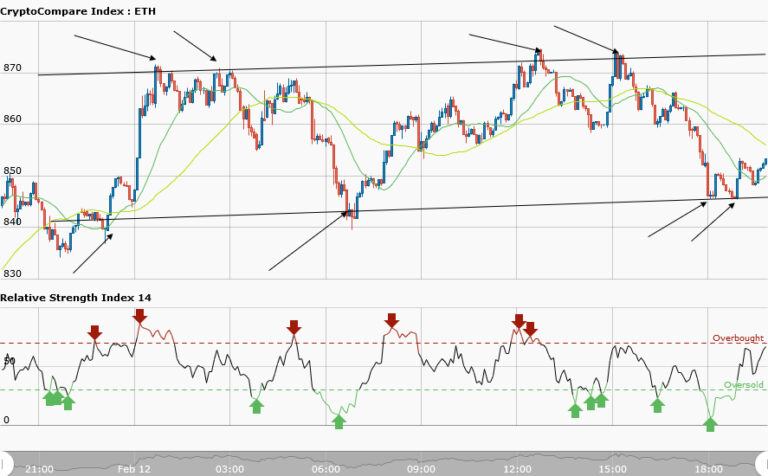
ETHUSD was trading at $829.32 yesterday in a sideways movement. Today, Bitcoin is in a sideways market but trading at $854.79 which is about 3% price increase. From the chart the resistance level is the price at $870 while the support level is the price at $840. The price tested the resistance and support level four times each . That is traders have eight trading opportunities if trading commenced at the beginning of this sideways trend.
At the resistance level and at every signal you take a short trade and close this position near the support zone for profits. Similarly, at the support level and at every signal you take a long position and close this trade near resistance zone for profits. However, the 50-day moving average and 20-day moving average are trending sideways whereas the RSI period 14 is level 66 indicating the average gains is higher than average losses.
ETHUSD Short-term trend: Bullish

The short term trend is bullish. The 50-day moving average and 20-day moving average are trending northward whereas the RSI period 14 is level 66 indicating average gains higher than average losses. Traders can take long trade at the support level of uptrend.


