
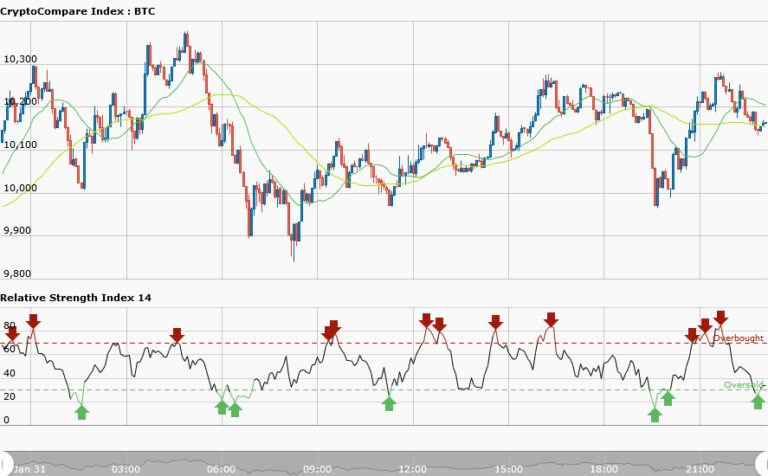

BTCUSD Long-Term Trend: Bearish
Resistance: $10,400, $10,300, $10,200
Support: $9,600, $9,800, $10,000
Yesterday, the price charts indicated that bitcoin is back above $10,000. However, there is doubt about how long the bitcoin will maintain its current status. It has moved up to about $10,300 but the trend is still bearish. The 50-day moving average (MA) and 20-day moving average are trending lower. The 20-day moving average has a stronger bearish move; whereas the RSI indicator shows that price has reached the oversold condition.
However, today the market is still bearish; the gains of yesterday may not be sustained. The support levels of $9,600, $9,800, and $10,000 may be breached.
BTCUSD Short-Term Trend: Bearish
The bearish move seems to have begun in earnest. The gains of yesterday may be erased. However, the market is retracing at a price of $10,275 and in a downtrend, it is expected that if price retraces from the low, it will encounter resistance at one of the Fib retracement levels of 23.6, 38.2, 50.00, or 61.8 which will give traders the opportunity to short.
The principle behind price action is that if an exhaustive candlestick forms above or below a Fib retracement level, it gives you a confirmation that the level will hold for some time. The price retraced and breached at Fib retracement level of 23.6. However, the support level of 9,600, 9, 800, and 10,000 would be tested as the downward trend gathers momentum.


