

BTCUSD Medium-term Trend: Bearish
Resistance: $10,800, $10,600, $10,400
Support: $9,600, $9,800, $10,000
Yesterday, February 22, BTCUSD pair was trading at $10,717.19 in a bearish market. The assumptions of yesterday’s post were that the weekly chart was said to be oversold suggesting bulls control of the market. Now if the bulls take control and breached the resistance level of $12,000 that would end the bears market and price will begin to appreciate.
However, if the bears take control and breached the support level of $10,000 then we will begin to experience the lows we had in January this year. As of writing, bitcoin has fallen from its recent high of $11,958 on February 20 to $9,722.49.Today, bitcoin is trading at $9,722.49 as a result of its bearish reversal.
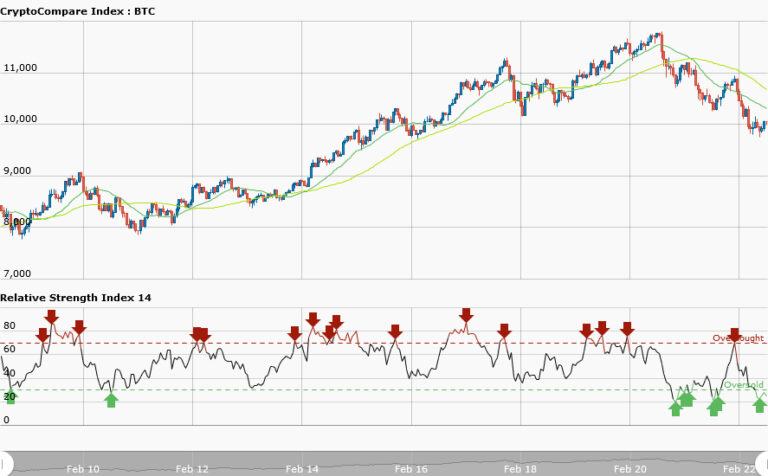
The 20-day moving average is below the 50-day moving average indicating that price is falling and trending southward whereas RSI period 14 is level 27 which indicates that the market is oversold suggesting bulls control.
BTCUSD Short-term Trend: Bearish

BTCUSD pair in the daily chart has a bearish outlook. The 50-day and 20-day moving averages are trending southward whereas the RSI period 14 is 75 indicating that the market is overbought suggesting bears takeover of the market.


