

BTCUSD Medium-term Trend: Sideways
Resistance: $9,000, $8,900, $8,800
Support: $8,400, $8,500, $8,600
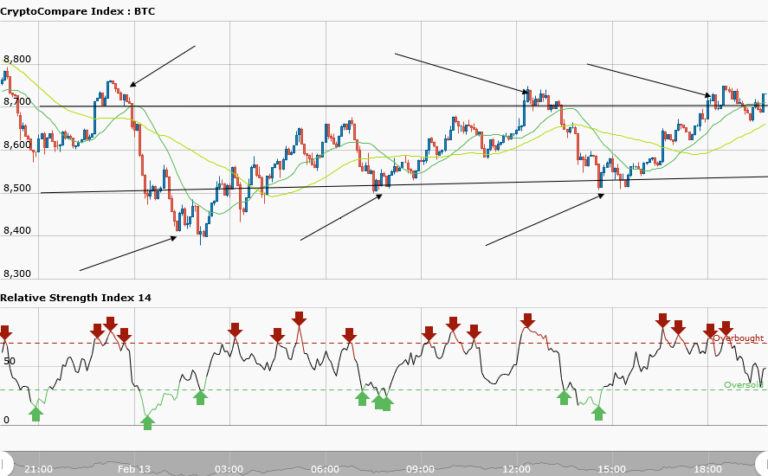
BTCUSD pair is trading in a sideways pattern today. The resistance and support levels are still the same as at yesterday. It was trading at $8,695.67 yesterday in a bullish market but today the price has risen to $8,733.42 which is about 0.4% price increase. The price increase is insignificant.However, two trend lines have been drawn to determine the direction of the market.
The price at $8,700 is the resistance level whereas the price at $8,500 is the support level. If we commence trading at the beginning of the sideways trend; we will have three trading opportunities at each level of the market. At the resistance level you can take a short trade at each point of the arrow where the price broke the trend line and then retrace back.
Similarly, you can take a long trade at each point of the arrow where the price broke the support level and then retrace back.Your take profit for short order is at the support zone while your take profit for long order is at the resistance zone. The RSI period 14 is level 47. This means the price has declined and that losses are dominant. The 50-day moving average and 20-day moving average are trending sideways.
BTCUSD Short-term Trend: Sideways

The short term trend is in a sideways movement. The same application is to be followed in the short term trend. You place your order as you see the market retracing ;as in the case of the medium term trend.


