

BTCUSD Medium-term Trend: Bullish
Resistance: $9,000, $8,900, $8,800
Support: $8,400, $8,500, $8,600
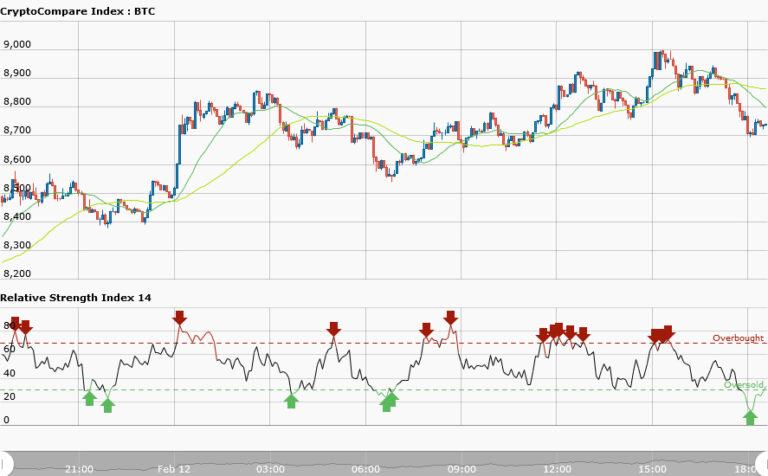
BTCUSD pair was trading at $8,283.33 yesterday in a sideways market. Today it is trading at $8,695.67 which is about 4.97% price increase. Bitcoin has a bullish movement but the market has not moved expectedly because of the slim price percentage. The 50-day moving average and 20-day moving average are trending northward but the lower moving average is below the higher moving average.
That is price is retracing from high to the downside. Whereas the RSI period 14 is level 33 indicating that the market is in the oversold condition. This also means the bears selling power is also being exhausted. Traders should initiate long orders since the market is oversold.
BTCUSD Short-term Trend: Bearish

The short term trend is bearish. The 50-day moving average and 20-day moving average are trending southward but the lower moving average is below the higher moving average. The RSI period 14 is level 18 which indicates that the market is in the oversold region. That is the selling pressure of the bears will soon be exhausted and bulls taking control. Traders are to initiate long orders. The support levels of $8,400, $8,500, or $8,600 may be breached.


