

BTCUSD long-term trend: Sideways
Resistance: $11,000, $10,000, $9,000
Support: $5,000, $6,000, $7,000
BTCUSD pair has been in a bearish move since February 1, and last week. On February 1, Bitcoin moved up to $10,300 benchmark but analyst expressed doubts of how long bitcoin will maintain its current status. The pair actually nosedived to maintain its bearish outlook.
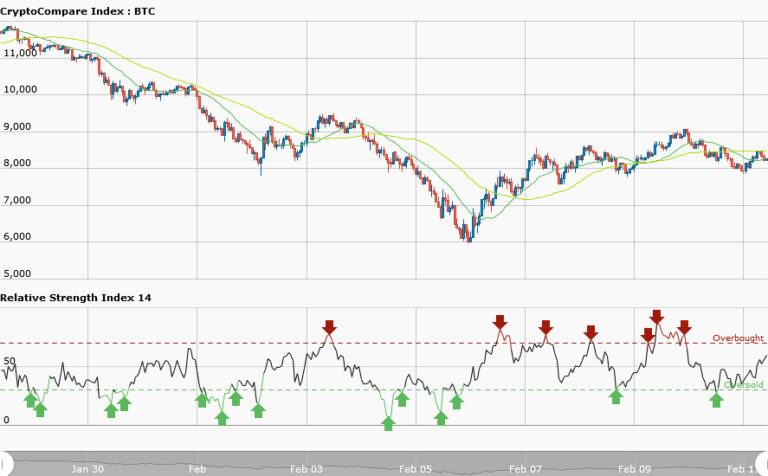
Today, Bitcoin has fallen to $8,283.33 which is about 19.5% fall in price since February 1.The long term trend this week will be a sideways movement. Prices will be fluctuating up and down without any meaningful impart the pair.The 50-day moving average (MA) and 20-day moving average are moving sideways whereas RSI period14 is level 56 indicating that the pair has average gains over average losses suggesting that the bears will soon take control.
Traders should abstain from trading since the market has no clear direction.
BTCUSD Medium-term trend: Sideways

The medium-term trend is a sideways movement. It is a good example of a tradable market. Four trend lines have been drawn to show how price has been retesting the support and resistance levels. There are two major key levels on the chart: the price level of $8,500 is a key resistance where you can take short trades. Also, the price of $7,900 is a major support level where a trader can take long trades.


