
Introduction
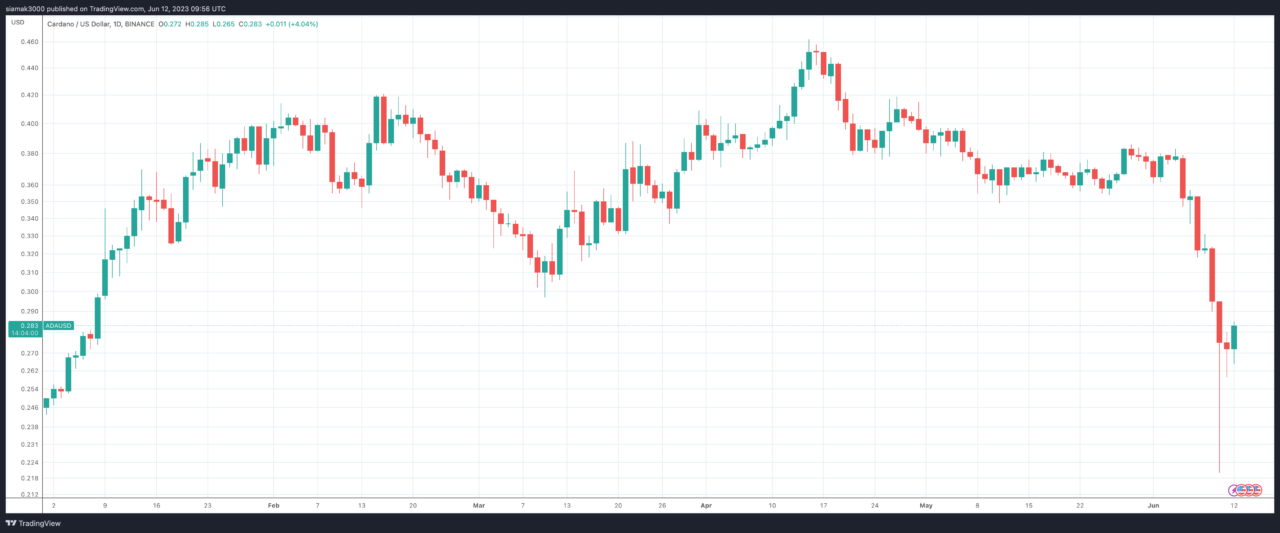
This report provides a comprehensive analysis of Cardano (ADA)’s price dynamics on Binance, covering technical indicators, moving averages, and pivot points.
Price and Volume Snapshot
At the time of the report, Cardano (ADA) was priced at $0.2824, experiencing an increase of $0.0205 (+7.83%) compared to the previous period. The snapshot was taken at 05:44:11 UTC, with a trading volume of 289,460,007 units on Binance.
Technical Indicators
Technical indicators are mathematical calculations based on an asset’s price and volume. They are used to predict future price movements and identify trading opportunities.
- RSI(14): The Relative Strength Index (RSI) measures the speed and change of price movements. An RSI value of 64.336 is considered a buy signal, suggesting bullish momentum.
- STOCH(9,6): The Stochastic Oscillator compares a particular closing price of an asset to a range of its prices over a certain period of time. The value of 62.257 is considered a buy signal, suggesting bullish momentum.
- STOCHRSI(14): The Stochastic RSI is an oscillator that measures the level of the RSI relative to its high-low range over a set time period. A value of 88.304 indicates overbought conditions, suggesting a potential price reversal or slowdown in the near future.
- MACD(12,26): The Moving Average Convergence Divergence (MACD) is a trend-following momentum indicator. A positive MACD value (0.004) indicates a buy signal, suggesting a bullish trend.
- ADX(14): The Average Directional Index (ADX) measures trend strength without regard to trend direction. A value of 40.474 is considered a buy signal, suggesting a strong trend is present.
- Williams %R: The Williams %R is a momentum indicator that measures overbought and oversold levels. A value of -15.344 indicates overbought conditions, suggesting a potential price reversal or slowdown in the near future.
- CCI(14): The Commodity Channel Index (CCI) is a momentum-based oscillator used to help determine when an investment vehicle is reaching a condition of being overbought or oversold. A value of 172.4354 is considered a buy signal, suggesting bullish momentum.
- ATR(14): The Average True Range (ATR) is a technical analysis indicator that measures market volatility. A value of 0.0047 suggests less volatility.
- Highs/Lows(14): This value of 0.0048 is a buy signal, suggesting bullish momentum.
- Ultimate Oscillator: The Ultimate Oscillator is a technical indicator that is used to generate buy and sell signals, incorporating the price action of an asset for three different time periods. A value of 51.581 indicates a buy signal, suggesting bullish momentum.
- ROC: The Rate of Change (ROC) is a momentum oscillator, which measures the percentage change between the current price and the n period past price. A value of 2.698 is a buy signal, suggesting bullish momentum.
- Bull/Bear Power(13): The Bull Power/Bear Power indicator measures the buying or sellingpressure in the market. A value of 0.0163 is a buy signal, suggesting bullish momentum.
Here is a summary of the technical indicators:
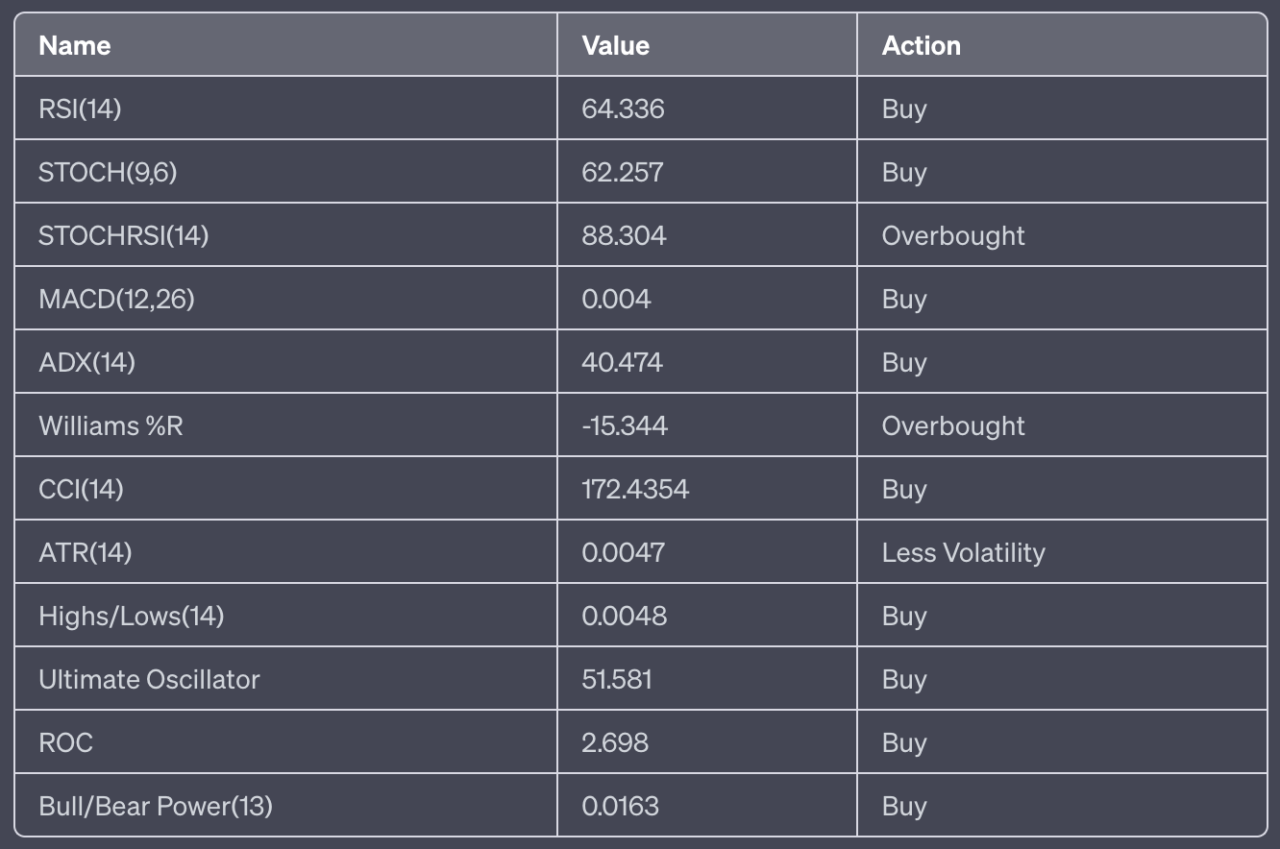
In summary, the technical indicators suggest a strong bullish sentiment for ADA. There are 9 buy signals, 0 sell signals, and 0 neutral signals. The overall summary is a strong buy.
Moving Averages
Moving averages are a type of data smoothing technique that analysts use in technical analysis to identify trends in a set of data, such as stock prices. They help to reduce the noise and fluctuation in price data to present a smoother line, making it easier to see the overall direction or trend.
There are several types of moving averages, but two of the most common ones are the Simple Moving Average (SMA) and the Exponential Moving Average (EMA).
- Simple Moving Average (SMA): The SMA is calculated by adding together the prices for a certain number of periods and then dividing by that number of periods. For example, a 5-day SMA would add together the closing prices for the last 5 days and then divide by 5. The SMA gives equal weight to all the data points in its calculation.
- Exponential Moving Average (EMA): The EMA is similar to the SMA, but it gives more weight to recent data. This means it responds more quickly to recent price changes than the SMA. The calculation of the EMA is a bit more complex than the SMA, involving an exponential smoothing factor to give more weight to recent prices.
The significance of different period moving averages (like 5-day, 10-day, 20-day, 50-day, 100-day, and 200-day) lies in the timeframe that traders are interested in:
- 5-day, 10-day, and 20-day moving averages are often used for short-term trends. They respond quickly to price changes and are useful for traders looking to take advantage of short-term price movements.
- 50-day and 100-day moving averages are more medium-term. They are less sensitive to daily price fluctuations and provide a clearer picture of the medium-term trend.
- 200-day moving average is a long-term trend indicator. It’s less sensitive to daily price fluctuations and provides a clearer picture of the long-term trend. Many traders consider a market to be in a long-term uptrend when the price is above the 200-day moving average and in a long-term downtrend when it’s below.
It’s important to note that moving averages are lagging indicators, meaning they are based on past prices. They can help identify a trend but won’t predict future price movements.
The 5-day, 10-day, 20-day, and 50-day simple and exponential moving averages (SMA and EMA) indicate a buy, suggesting bullish momentum in the short term. However, the 100-day and 200-day SMA and EMA indicate a sell, suggesting a bearish trend in the longer term.
Here is a summary of the moving averages in table form:
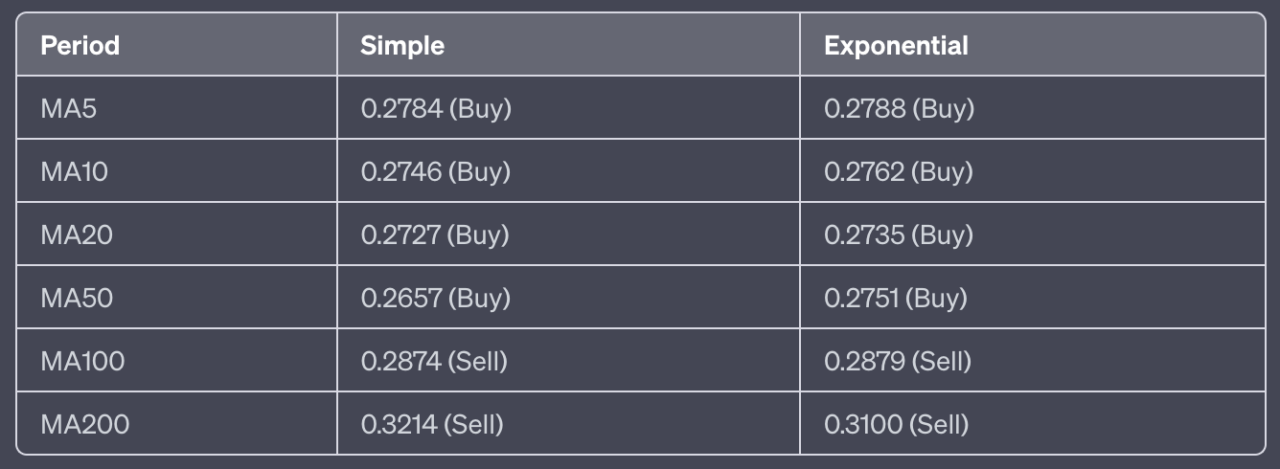
In summary, the moving averages suggest a buy trend with a slight bearish momentum in the long term. There are 8 buy signals and 4 sell signals. The overall summary is a buy.
Pivot Points
Pivot points are used by traders as a predictive indicator and to denote levels of technical significance. When used in conjunction with other technical indicators, pivot points can help to spot significant price movements.
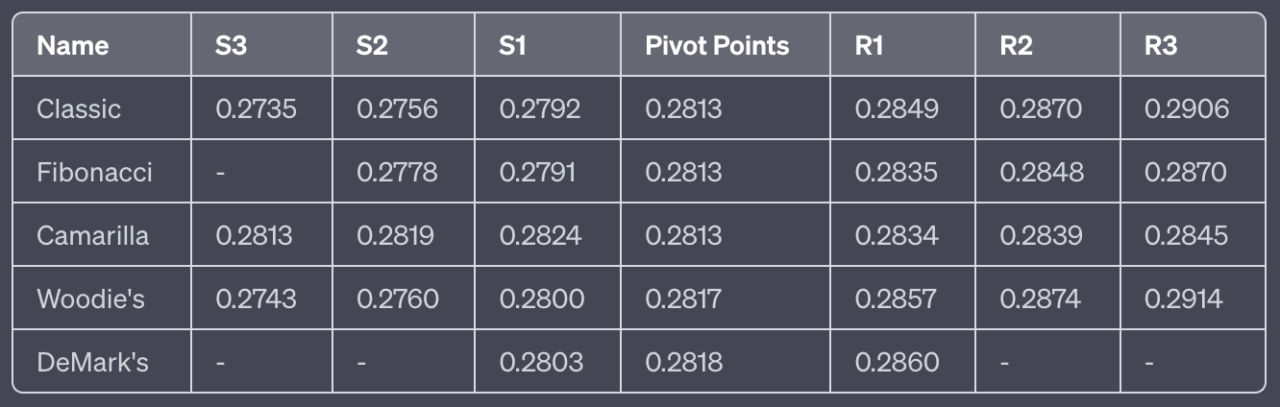
For the Classic pivot points, the pivot point is at $0.2813, with support levels at $0.2792 (S1), $0.2756 (S2), and $0.2735 (S3), and resistance levels at $0.2849 (R1), $0.2870 (R2), and $0.2906 (R3).
The Fibonacci pivot points suggest a pivot point at $0.2813, with support levels at $0.2791 (S1), $0.2778 (S2), and resistance levels at $0.2835 (R1), $0.2848 (R2), and $0.2870 (R3).
The Camarilla pivot points indicate a pivot point at $0.2813, with support levels at $0.2824 (S1), $0.2819 (S2), and $0.2813 (S3), and resistance levels at $0.2834 (R1), $0.2839 (R2), and $0.2845 (R3).
The Woodie’s pivot points suggest a pivot point at $0.2817, with support levels at $0.2800 (S1), $0.2760 (S2), $0.2743 (S3), and resistance levels at $0.2857 (R1), $0.2874 (R2), and $0.2914 (R3).
The DeMark’s pivot points indicate a pivot point at $0.2818, with support at $0.2803 (S1) and resistance at $0.2860 (R1).
Here is a summary of the pivot points in table form:
Featured Image Credit: Photo / illustration by “Dylan Calluy” via Unsplash