
Introduction
This report provides a comprehensive analysis of ADA’s price dynamics on Binance, covering technical indicators, moving averages, pivot points, and more.
Price and Volume Snapshot
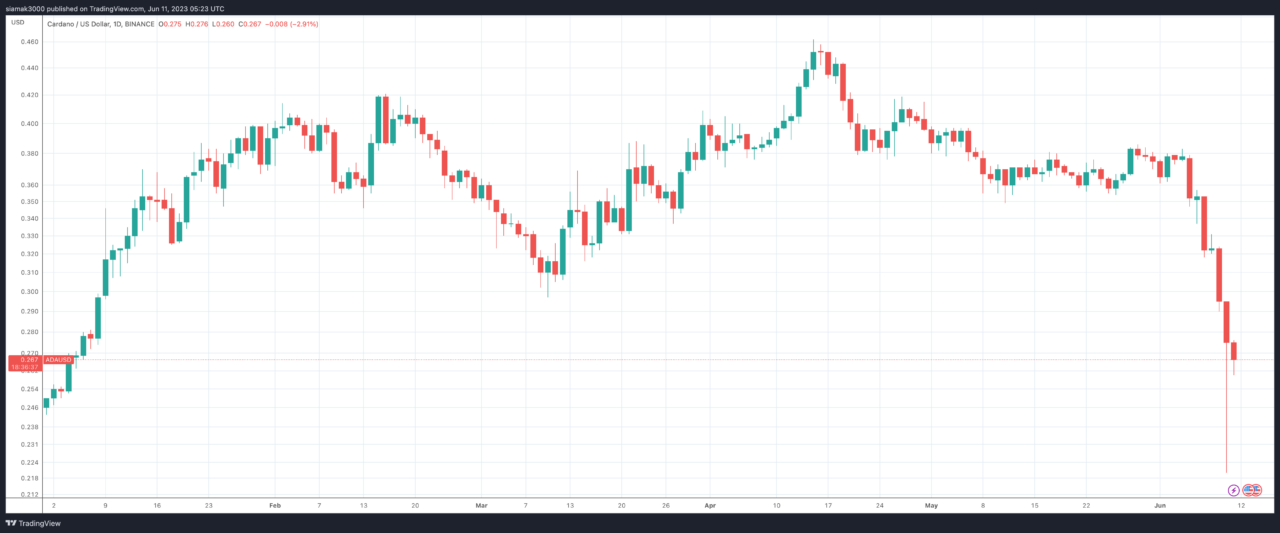
At the time of the report, Cardano (ADA) was priced at $0.2645, experiencing an increase of $0.0211 (+8.67%) compared to the previous period. The snapshot was taken at 05:07:44 UTC, with a trading volume of 572,123,455 units on Binance.
Technical Indicators
Technical indicators are mathematical calculations based on an asset’s price and volume. They are used to predict future price movements and identify trading opportunities.
- RSI (14): The Relative Strength Index (RSI) measures the speed and change of price movements. An RSI value of 46.286 is considered neutral, suggesting a balance between buying and selling pressures.
- STOCH (9,6): The Stochastic Oscillator compares a particular closing price of an asset to a range of its prices over a certain period of time. The value of 29.102 is considered a sell signal, suggesting bearish momentum.
- STOCHRSI (14): The Stochastic RSI is an oscillator that measures the level of the RSI relative to its high-low range over a set time period. A value of 50.376 indicates neutral conditions, suggesting a balance between buying and selling pressures.
- MACD (12,26): The Moving Average Convergence Divergence (MACD) is a trend-following momentum indicator. A negative MACD value (-0.004) indicates a sell signal, suggesting a bearish trend.
- ADX (14): The Average Directional Index (ADX) measures trend strength without regard to trend direction. A value of 32.567 indicates a sell signal, suggesting the presence of a strong downtrend.
- Williams %R: The Williams %R is a momentum indicator that measures overbought and oversold levels. A value of -59.328 indicates a sell signal, suggesting bearish momentum.
- CCI (14): The Commodity Channel Index (CCI) is a momentum-based oscillator used to help determine when an investment vehicle is reaching a condition of being overbought or oversold. A value of -18.3206 indicates neutral conditions, suggesting a balance between buying and selling pressures.
- ATR (14): The Average True Range (ATR) is a technical analysis indicator that measures market volatility. A value of 0.0058 suggests less volatility.
- Highs/Lows (14): This value of 0.0000 is neutral, suggesting a balance between buying and selling pressures.
- Ultimate Oscillator: The Ultimate Oscillator is a technical indicator that is used to generate buy and sell signals, incorporating the price action of an asset for three different time periods. A value of 35.511 indicates a sell signal, suggesting bearish momentum.
- ROC: The Rate of Change (ROC) is a momentum oscillator, which measures the percentage change between the current price and the n period past price. A value of 3.934 is a buy signal, suggesting bullish momentum.
- Bull/Bear Power (13): The Bull Power/Bear Power indicator measures the buying or selling pressure in the market. A value of 0.0020 is a buy signal, suggesting bullish momentum.
Overall, the technical indicators suggest a sell signal with some signs of potential price reversal due to overbought conditions.
Moving Averages Analysis
Moving averages smooth out price data to form a trend-following indicator. They do not predict price direction but rather define the current direction with a lag.
- Simple Moving Averages (SMA): The SMA for the 5-day period is indicating a sell, suggesting bearish momentum in the short term. The SMA for the 10-day period is also indicating a sell, suggesting a bearish trend. However, the SMA for the 20-day period is indicating a buy, suggesting bullish momentum in the short term. The SMA for the 50-day, 100-day, and 200-day periods are all indicating a sell, suggesting a bearish trend in the longer term.
- Exponential Moving Averages (EMA): The EMA for the 5-day period is indicating a sell, suggesting bearish momentum in the short term. The EMA for the 10-day period is also indicating a sell, suggesting a bearish trend. The EMA for the 20-day period is indicating a sell, suggesting bearish momentum. The EMA for the 50-day, 100-day, and 200-day periods are all indicating a sell, suggesting a bearish trend in the longer term.
Overall, the moving averages suggest a strong sell trend with a slight bullish momentum in the short term.
Pivot Points Analysis
Pivot points are used by traders as a predictive indicator and to denote levels of technical significance. When used in conjunction with other technical indicators, pivot points can help to spot significant price movements.
For the Classic pivot points, the pivot point is at 0.2628, with support levels at 0.2610 (S1), 0.2586 (S2), and 0.2568 (S3), and resistance levels at 0.2652 (R1), 0.2670 (R2), and 0.2694 (R3).
The Fibonacci pivot points suggest a pivot point at 0.2628, with support levels at 0.2612 (S1), 0.2602 (S2), and resistance levels at 0.2644 (R1), 0.2654 (R2), and 0.2670 (R3).
The Camarilla pivot points indicate a pivot point at 0.2628, with support levels at 0.2631 (S1), 0.2627 (S2), and 0.2623 (S3), and resistance levels at 0.2656 (R1), 0.2647 (R2), and 0.2643 (R3).
For the Woodie’s pivot points, the pivot point is at 0.2630, with support levels at 0.2614 (S1), 0.2588 (S2), and 0.2572 (S3), and resistance levels at 0.2656 (R1), 0.2672 (R2), and 0.2698 (R3).
The DeMark’s pivot points suggest a potential resistance level at 0.2641 and a potential support level at 0.2598.
These levels indicate potential entry and exit points for traders.
Conclusion
The comprehensive analysis of Cardano (ADA)’s price dynamics on the Binance exchange reveals a strong sell signal in the short term, as suggested by the majority of the technical indicators and the moving averages. However, the pivot points analysis provides potential support and resistance levels, which traders can use to identify potential entry and exit points.
While the analysis provides valuable insights into the potential price trends, it is crucial for traders and investors to conduct additional research and consider multiple factors before making investment decisions.
Featured Image Credit: Photo / illustration by “Dylan Calluy” via Unsplash