
Introduction
This report provides a comprehensive analysis of Cardano’s (ADA) price dynamics, covering technical indicators and moving averages.
Price and Volume Overview
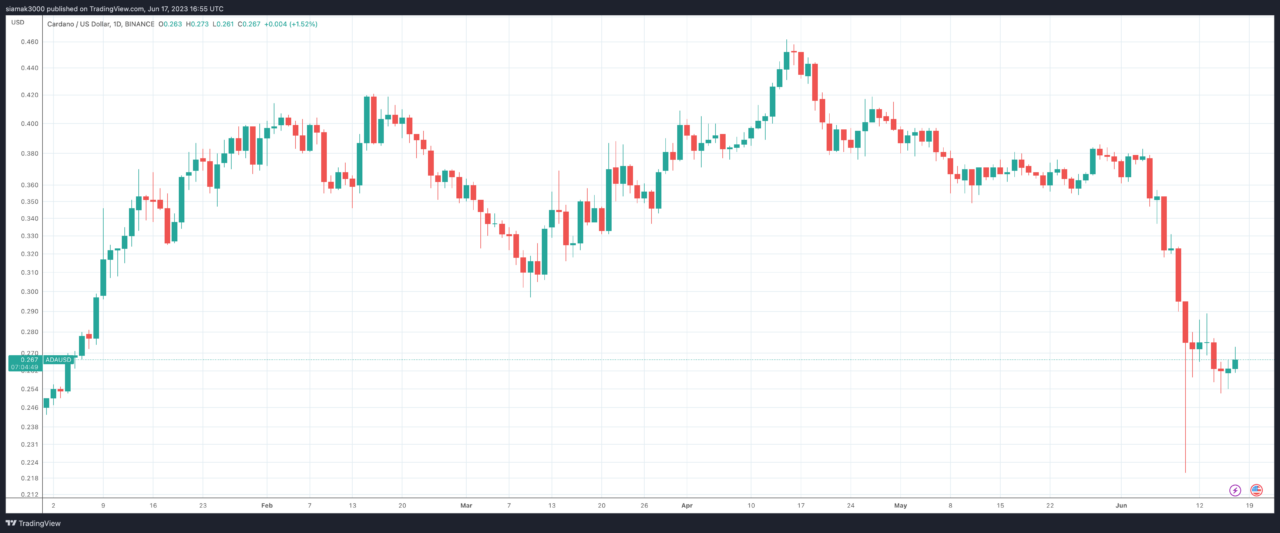
As of 4:52 p.m. UTC on 17 June 2023, on Binance, the price of ADA is $0.2671, which is an increase of $0.0059 (+2.26%) from the previous close. The volume of ADA traded in the last 24 hours is 104,159,185. The highest price of ADA in the last 24 hours was $0.2737, and the lowest price was $0.2607. The bid price and the ask price are $0.2670 and $0.2671, respectively.
Technical Indicators
Technical indicators are mathematical calculations that use historic price, volume, and (in the case of futures contracts) open interest information to predict future price movements.
Here’s a detailed breakdown of the technical indicators for ADA:
- RSI(14): The Relative Strength Index (RSI) compares the magnitude of recent gains to recent losses in an attempt to determine overbought and oversold conditions of an asset. An RSI of 54.343 indicates a neutral position.
- STOCH(9,6): The Stochastic Oscillator compares a security’s closing price to its price range over a specific period of time. A value of 34.110 indicates a sell condition.
- STOCHRSI(14): The Stochastic RSI combines two popular indicators, the Stochastic Oscillator and the Relative Strength Index. A value of 17.843 suggests that the asset is in an oversold condition.
- MACD(12,26): The Moving Average Convergence Divergence (MACD) is a trend-following momentum indicator that shows the relationship between two moving averages of a security’s price. A value of 0.001 indicates a buy position.
- ADX(14): The Average Directional Index (ADX) is used to measure the strength or weakness of a trend, not the actual direction. A value of 32.571 indicates a sell position.
- Williams %R: The Williams %R is a momentum indicator that measures overbought and oversold levels. A value of -55.652 suggests that the asset is in a sell condition.
- CCI(14): The Commodity Channel Index (CCI) is a momentum-based oscillator used to help determine when an investment vehicle is reaching a condition of being overbought or oversold. A value of -34.4691 indicates a neutral position.
- ATR(14): The Average True Range (ATR) is a market volatility indicator. A value of 0.0025 suggests less volatility.
- Highs/Lows(14): This value represents the highest and lowest prices over the last 14 days. A value of 0.0000 indicates a neutral position.
- Ultimate Oscillator: The Ultimate Oscillator is a technical indicator that is used to identify potential price reversals. A value of 47.467 indicates a sell position.
- ROC: The Rate of Change (ROC) is a momentum oscillator, which measures the percentage change between the current price and the n-period past price. A value of 1.792 indicates a buy position.
- Bull/Bear Power(13): The Elder-Ray Index, developed by Dr. Alexander Elder, is an oscillator that measures the power of bulls and bears in the market. A value of -0.0017 indicates a sell position.
Here is a summary of the technical indicators in table form:
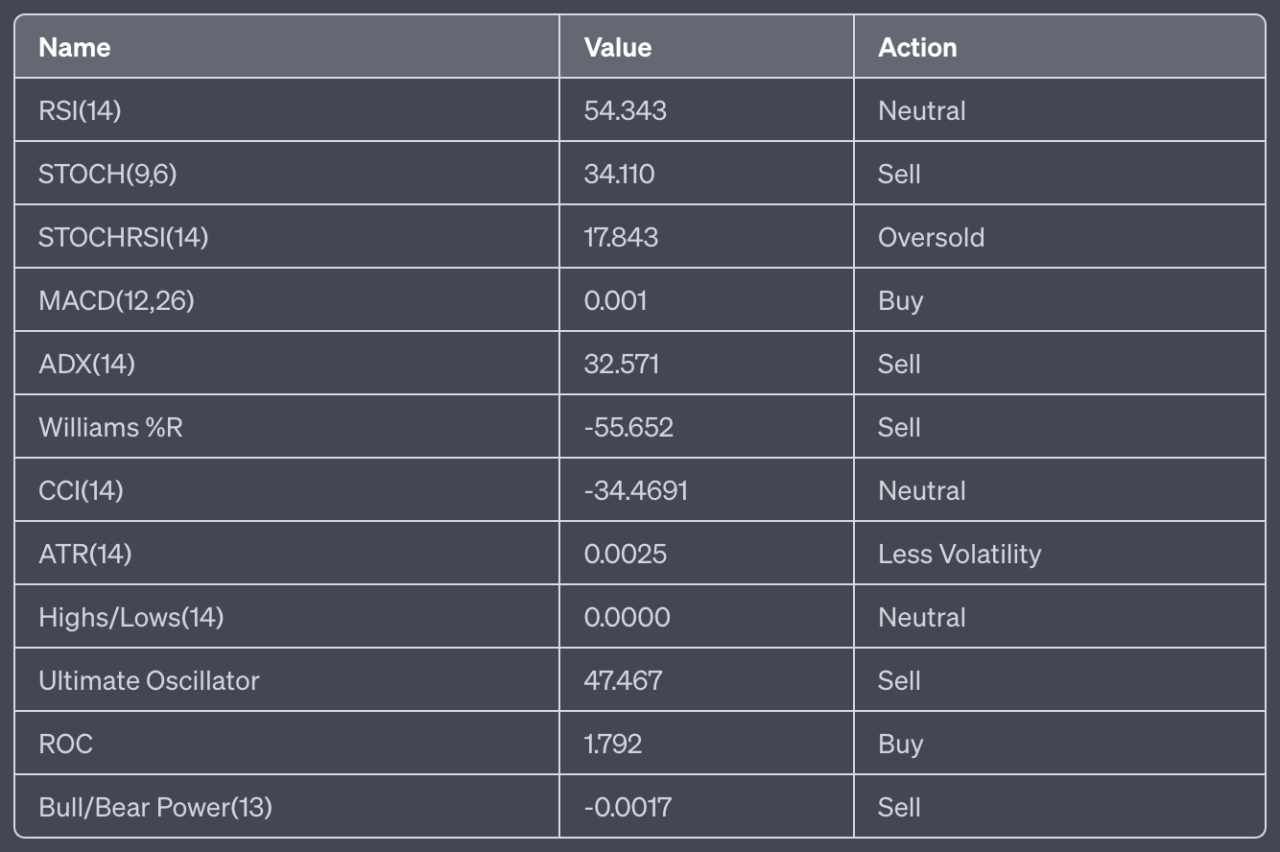
In summary, the technical indicators suggest a mixed sentiment for ADA since there are two buy signals, five sell signals, and three neutral signals. The overall summary is a SELL.
Moving Averages
Moving averages are a type of data smoothing technique that analysts use in technical analysis to identify trends in a set of data, such as stock prices. They help to reduce the noise and fluctuation in price data to present a smoother line, making it easier to see the overall direction or trend.
There are several types of moving averages, but two of the most common ones are the Simple Moving Average (SMA) and the Exponential Moving Average (EMA).
- Simple Moving Average (SMA): The SMA is calculated by adding together the prices for a certain number of periods and then dividing by that number of periods. For example, a 5-day SMA would add together the closing prices for the last five days and then divide by five. The SMA gives equal weight to all the data points in its calculation.
- Exponential Moving Average (EMA): The EMA is similar to the SMA, but it gives more weight to recent data. This means it responds more quickly to recent price changes than the SMA. The calculation of the EMA is a bit more complex than the SMA, involving an exponential smoothing factor to give more weight to recent prices.
The significance of different period moving averages (like 5-day, 10-day, 20-day, 50-day, 100-day, and 200-day) lies in the timeframe that traders are interested in:
- 5-day, 10-day, and 20-day moving averages are often used for short-term trends. They respond quickly to price changes and are useful for traders looking to take advantage of short-term price movements.
- 50-day and 100-day moving averages are more medium-term. They are less sensitive to daily price fluctuations and provide a clearer picture of the medium-term trend.
- 200-day moving average is a long-term trend indicator. It’s less sensitive to daily price fluctuations and provides a clearer picture of the long-term trend. Many traders consider a market to be in a long-term uptrend when the price is above the 200-day moving average and in a long-term downtrend when it’s below.
It’s important to note that moving averages are lagging indicators, meaning they are based on past prices. They can help identify a trend but won’t predict future price movements.
Here’s a detailed breakdown of the moving averages for Cardano (ADA):
- MA5: The 5-day moving average is $0.2669 (SMA) and $0.2671 (EMA), indicating a buy position for SMA and a sell position for EMA.
- MA10: The 10-day moving average is $0.2681 (SMA) and $0.2670 (EMA), indicating a sell position for both SMA and EMA.
- MA20: The 20-day moving average is $0.2663 (SMA) and $0.2663 (EMA), indicating a buy position for both SMA and EMA.
- MA50: The 50-day moving average is $0.2632 (SMA) and $0.2653 (EMA), indicating a buy position for both SMA and EMA.
- MA100: The 100-day moving average is $0.2659 (SMA) and $0.2661 (EMA), indicating a buy position for both SMA and EMA.
- MA200: The 200-day moving average is $0.2706 (SMA) and $0.2799 (EMA), indicating a sell position for both SMA and EMA.
Here is a summary of the moving averages in table form:
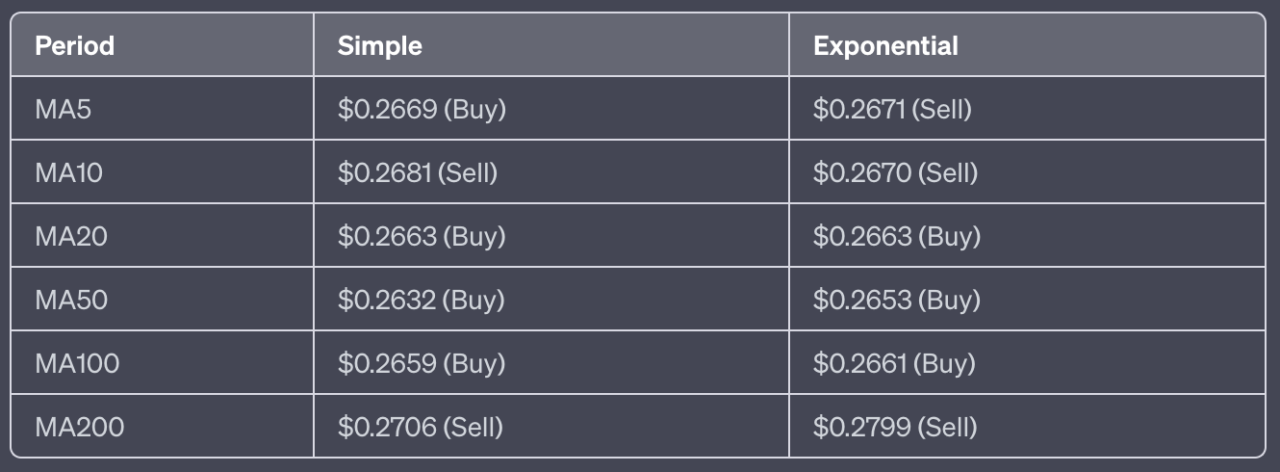
In summary, the moving averages suggest a mixed sentiment for ADA since there are seven buy signals and five sell signals. The overall summary is a BUY.
Conclusion
The technical indicators and moving averages present a mixed picture for Cardano (ADA). While the technical indicators suggest a sell position, the moving averages suggest a buy position.
Therefore, traders and investors should exercise caution and consider these factors when making their trading decisions. As always, it’s important to note that while technical analysis tools can provide useful insights, they are not a guarantee of future performance, and all trading strategies should be used in conjunction with other market information and individual research.
Featured Image Credit: Photo / illustration by “Dylan Calluy” via Unsplash