
Introduction
This report provides a comprehensive analysis of Cardano (ADA) based on the latest data as of 20 June 2023. The analysis includes a review of the current price, technical indicators, and moving averages.
Price and Volume Overview
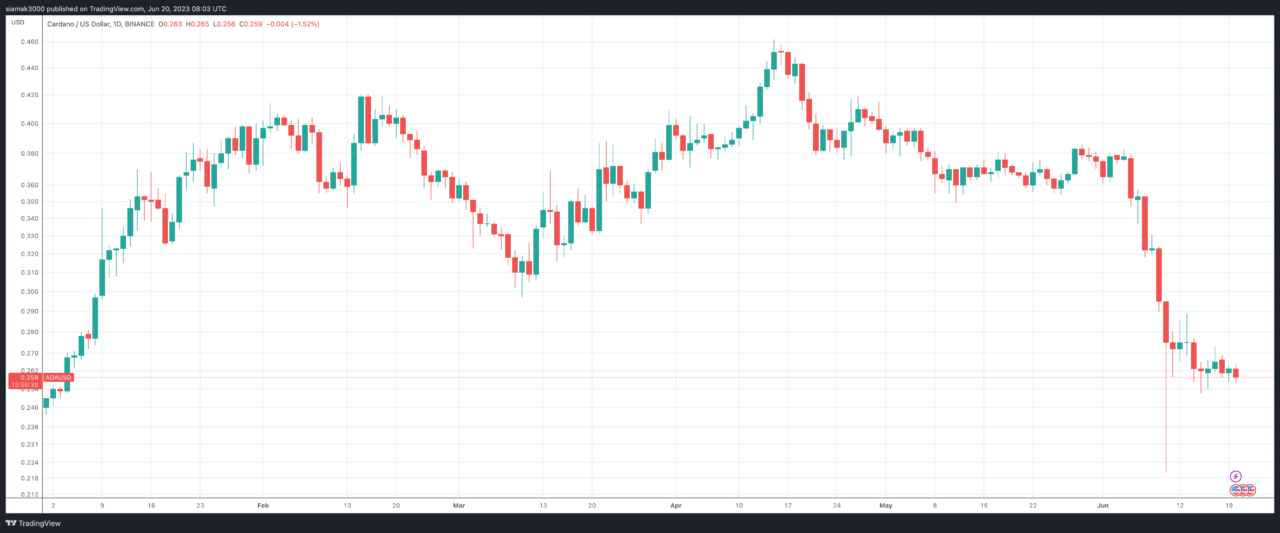
As of 7:51 a.m. UTC on 20 June 2023, Cardano (ADA) is trading at $0.2588, down by $0.0012 (-0.46%) as per the latest real-time data. The volume stands at 80,154,750 ADA. The bid and ask prices are $0.2588 and $0.2589, respectively, with the day’s range between $0.2571 and $0.2648.
Technical Indicators
Technical indicators are statistical tools used by traders and investors to predict future price movements and market trends.
Here’s a detailed breakdown of the technical indicators for Dogecoin (DOGE):
- RSI(14): The 14-day Relative Strength Index is 48.298, indicating a neutral position. The RSI measures the speed and change of price movements on a scale of 0 to 100. Traditionally, the asset is considered overbought when the RSI is above 70 and oversold when it’s below 30. In this case, DOGE is neither overbought nor oversold, suggesting a balance between buying and selling pressures.
- STOCH(9,6): The Stochastic Oscillator is 31.517, indicating a sell position. This momentum indicator compares a particular closing price of the asset to a range of its prices over a certain period of time. The current value suggests that DOGE is closer to its lows than its highs, which is typically viewed as a bearish signal.
- STOCHRSI(14): The Stochastic RSI is 9.433, indicating an oversold condition. This is a technical momentum indicator that compares the level of the RSI to its high-low range over a set time period. An oversold condition could indicate a buying opportunity as the price might rebound soon.
- MACD(12,26): The Moving Average Convergence Divergence is 0.000, indicating a neutral position. The MACD is a trend-following momentum indicator that shows the relationship between two moving averages of a security’s price. The MACD line crossing above the signal line can be a bullish signal, and when it crosses below, it can be a bearish signal. In this case, the MACD line is on the signal line, indicating a neutral position.
- ADX(14): The Average Directional Index is 21.271, indicating a neutral position. The ADX is used to measure the strength or weakness of a trend, not the actual direction. Values below 20 are often associated with non-trending markets, and values above 25 may indicate a trend.
- Williams %R: The Williams %R is -63.462, indicating a sell condition. This momentum indicator measures overbought and oversold levels. Readings range from 0 to -100, with -50 as the middle line. Readings above -20 are considered overbought, and readings below -80 are considered oversold. The current reading suggests that DOGE is in a sell condition.
- CCI(14): The Commodity Channel Index is -120.1974, indicating a sell position. The CCI is a momentum-based oscillator used to help determine when an investment vehicle is reaching a condition of being overbought or oversold. A CCI above 100 may indicate an overbought condition, while a CCI below -100 may indicate an oversold condition.
- ATR(14): The Average True Range is 0.0003, indicating less volatility. The ATR is a technical analysis indicator that measures market volatility by decomposing the entire range of an asset price for that period. Lower values typically represent less volatility and more stable price movements.
- Highs/Lows(14): The value is -0.0000, indicating a sell position. This indicator is used to identify the highest and lowest prices for the asset over a particular period.
- Ultimate Oscillator: The value is 33.520, indicating a sell position. This is a technical indicator that is used to measure momentum across multiple timeframes. A value below 30 often indicates an oversold condition, while a value above 70 indicates an overbought condition.
- ROC: The Rate of Change is -0.113, indicating a sell position. The ROC is a momentum oscillator, which measures the percentage change between the current price and the n-period past price. A negative ROC indicates a bearish signal, suggesting that the price is decreasing.
- Bull/Bear Power(13): The value is 0.0002, indicating a buy position. These indicators measure the balance of power between bulls (buyers) and bears (sellers). A positive value indicates that bulls are in control, while a negative value indicates that bears are in control.
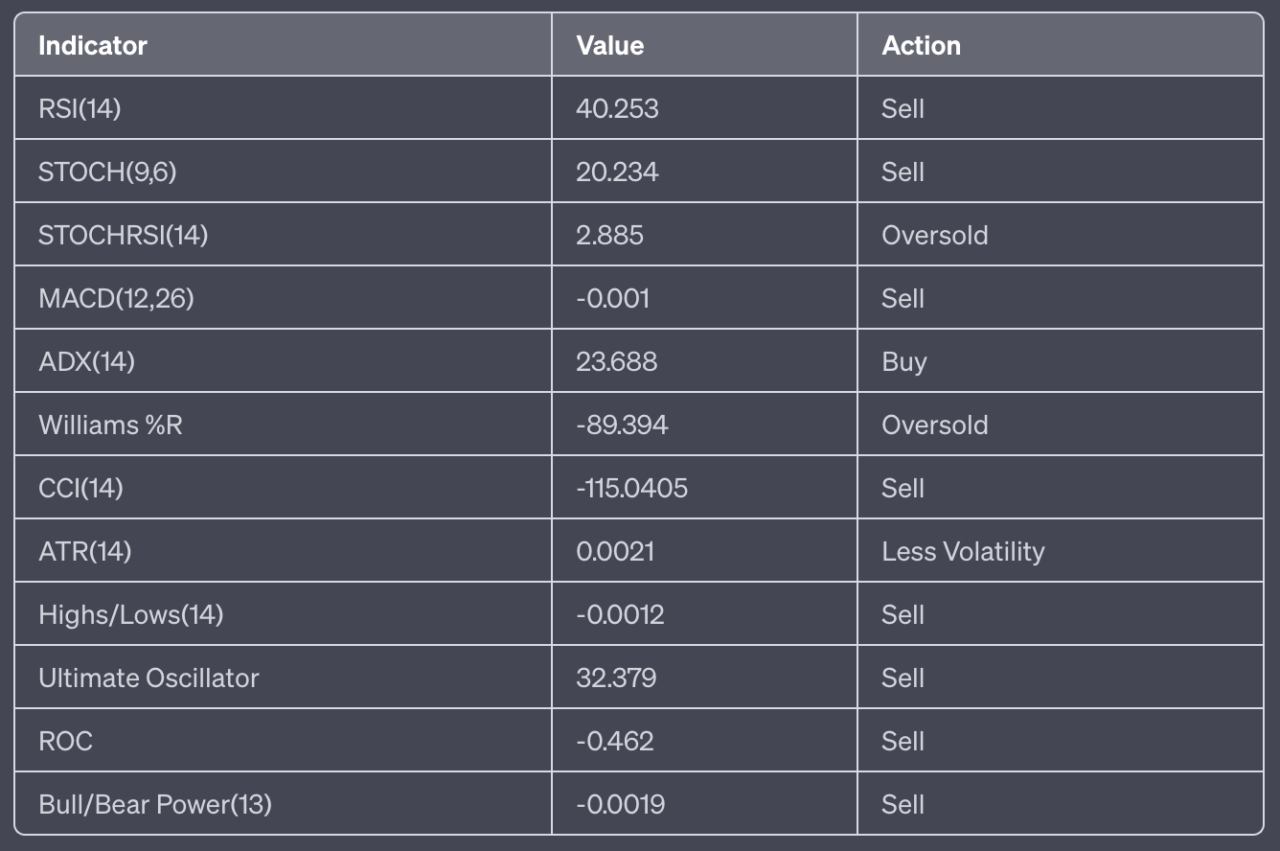
The summary of the technical indicators suggests a strong sell sentiment for Cardano (ADA), with eight out of eleven indicators suggesting a sell.
Moving Averages
Moving averages are a type of data smoothing technique that analysts use in technical analysis to identify trends in a set of data, such as stock prices. They help to reduce the noise and fluctuation in price data to present a smoother line, making it easier to see the overall direction or trend.
There are several types of moving averages, but two of the most common ones are the Simple Moving Average (SMA) and the Exponential Moving Average (EMA).
- Simple Moving Average (SMA): The SMA is calculated by adding the prices for a certain number of periods and then dividing by that number of periods. For example, a 5-day SMA would add the closing prices for the last five days and then divide by five. The SMA gives equal weight to all the data points in its calculation.
- Exponential Moving Average (EMA): The EMA is similar to the SMA but gives more weight to recent data. This means it responds more quickly to recent price changes than the SMA. The calculation of the EMA is a bit more complex than the SMA, involving an exponential smoothing factor to give more weight to recent prices.
The significance of different period moving averages (like 5-day, 10-day, 20-day, 50-day, 100-day, and 200-day) lies in the timeframe that traders are interested in:
- 5-day, 10-day, and 20-day moving averages are often used for short-term trends. They respond quickly to price changes and are useful for traders looking to take advantage of short-term price movements.
- 50-day and 100-day moving averages are more medium-term. They are less sensitive to daily price fluctuations and provide a clearer picture of the medium-term trend.
- 200-day moving average is a long-term trend indicator. It’s less sensitive to daily price fluctuations and provides a clearer picture of the long-term trend. Many traders consider a market to be in a long-term uptrend when the price is above the 200-day moving average and in a long-term downtrend when it’s below.
It’s important to note that moving averages are lagging indicators, meaning they are based on past prices. They can help identify a trend but won’t predict future price movements.
Here’s a detailed breakdown of the SMAs for Cardano (ADA):
- SMA5: The 5-day SMA is 0.2593. Since the current price (0.2588) is below this value, this is considered a sell signal.
- SMA10: The 10-day SMA is 0.2607. The current price is also below this value, indicating a sell signal.
- SMA20: The 20-day SMA is 0.2606. The current price is below this value, suggesting a sell signal.
- SMA50: The 50-day SMA is 0.2624. The current price is below this value, suggesting a sell signal.
- SMA100: The 100-day SMA is 0.2636. The current price is below this value, suggesting a sell signal.
- SMA200: The 200-day SMA is 0.2673. The current price is below this value, suggesting a sell signal.
Here’s a detailed breakdown of the EMAs for Cardano (ADA):
- EMA5: The 5-day EMA is 0.2595. Since the current price is below this value, this is considered a sell signal.
- EMA10: The 10-day EMA is 0.2599. The current price is below this value, indicating a sell signal.
- EMA20: The 20-day EMA is 0.2606. The current price is below this value, suggesting a sell signal.
- EMA50: The 50-day EMA is 0.2618. The current price is below this value, suggesting a sell signal.
- EMA100: The 100-day EMA is 0.2639. The current price is below this value, suggesting a sell signal.
- EMA200: The 200-day EMA is 0.2732. The current price is below this value, suggesting a sell signal.
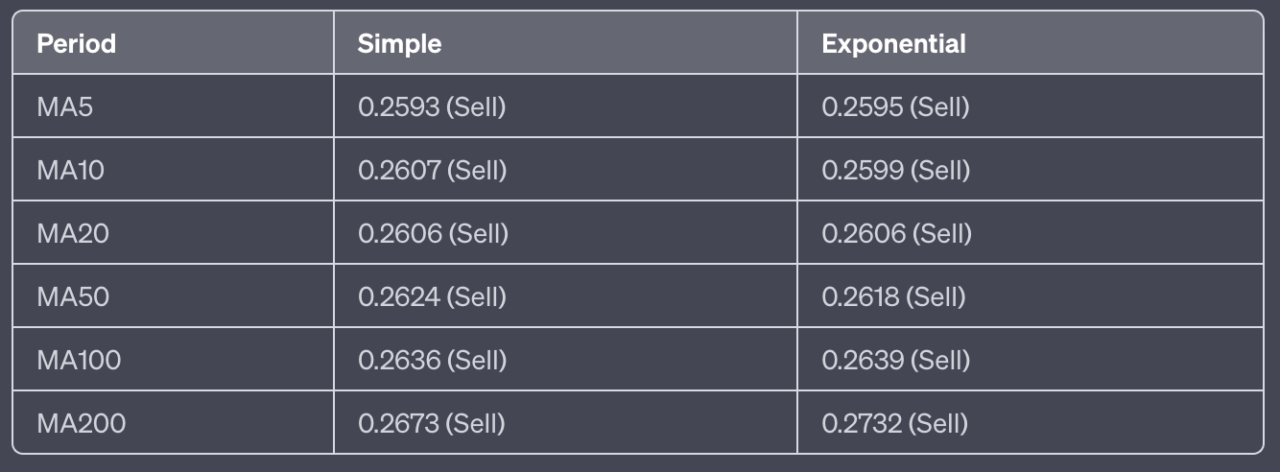
The moving averages for Cardano (ADA) suggest a bearish trend across multiple timeframes. The summary of the moving averages suggests a strong sell sentiment for Cardano (ADA) with 12 out of 12 indicators suggesting a sell.
Conclusion
As of 20 June 2023, the overall sentiment for Cardano (ADA) leans heavily towards a “Sell” position, as indicated by both the technical indicators and moving averages.
The technical indicators present a rather bearish picture for Cardano. The RSI, Stochastic Oscillator, Williams %R, CCI, Highs/Lows, Ultimate Oscillator, ROC, and Bull/Bear Power all suggest a sell signal. The ADX is neutral, indicating that the strength of the trend is weak. The MACD, a lagging indicator, is also neutral, suggesting that recent price changes have not been significant enough to trigger a bullish or bearish signal.
The Stochastic RSI is in the oversold territory, which could potentially indicate an upcoming price rebound. However, this should be interpreted with caution as prices can remain in oversold or overbought levels for extended periods during strong downtrends or uptrends, respectively.
The moving averages further reinforce the bearish sentiment. Both the simple and exponential moving averages across all periods (5, 10, 20, 50, 100, and 200 days) are above the current price, indicating a strong downtrend.
The 200-day SMA and EMA, often used to determine the overall market trend, are both above the current price, suggesting that Cardano has been in a long-term downtrend. The 5-day, 10-day, 20-day, and 50-day SMAs and EMAs, which are more sensitive to recent price movements, also suggest a short-term downtrend.
Both the technical indicators and moving averages suggest a bearish outlook for Cardano (ADA) as of 20 June 2023. However, it’s important to note that technical analysis is just one tool that investors can use to evaluate potential investment opportunities. Other factors, such as fundamental analysis, market news, and overall economic conditions, should also be considered when making investment decisions.
Moreover, while the technical indicators and moving averages suggest a sell signal, this does not necessarily mean that investors should sell their holdings immediately. Instead, they might want to consider these signals as a prompt to reevaluate their investment strategy and risk tolerance.
Investors who believe in the long-term potential of Cardano might view this bearish outlook as a buying opportunity, while others might choose to reduce their exposure or hedge their positions. As always, it’s crucial for each investor to consider their own investment goals, risk tolerance, and time horizon before making investment decisions.
Featured Image Credit: Photo / illustration by “Dylan Calluy” via Unsplash