

Ripple (XRP) has enjoyed a record-breaking month, rising in value by nearly 80%. What makes the price hike even more impressive is the fact that it happened in a bearish market, where most other cryptocurrencies suffered losses.
On September 21, Ripple rallied 75% registering an all-time high in daily XRP trading volume on Bitfinex. Analysts are still figuring out what could have caused the impressive rally.
The most popular opinion is that it was due to xRapid, a new product that could help banks speed up transactions using XRP. Others have theorized that the price surge was due to speculation surrounding Coinbase adding Ripple to its list of supported cryptocurrencies.
Swell, a blockchain event hosted by Ripple, may have also had a direct positive impact on the price, as former President Bill Clinton gave a positive speech on blockchain technology and cryptocurrencies.
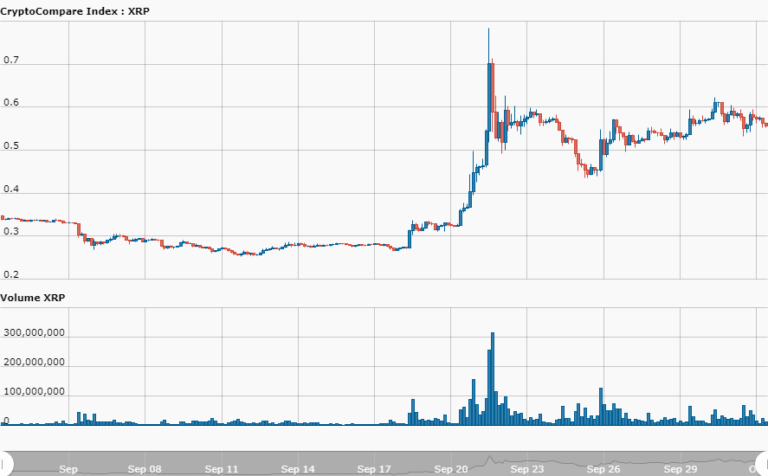
According to data from CryptoCompare, XRP registered the most significant growth from September 18 to 22. Breaking a large falling wedge pattern that had been forming since the peaks in January 2018, the price surged by more than 150% during that time interval, climbing from $0.27 to $0.69.
After peaking at more than $0.783 on September 21, the price fell but to the surprise of many analysts has so far stabilized around $0.55. Meaning XRP has posted impressive gains of 60% over the past 30 days.
The breaking of the falling wedge, together with positive indicators, suggest that Ripple might continue its upward trend. XRP is currently trading at $0.55, with a strong resistance line at $0.60.


